Long
LEND.USDT (Y20.P4.E3).Macro.Bullish short term
Hi All,
Note: Another chart continuing off from the previous post, link supplied below.
Also note, log disabled on the chart.
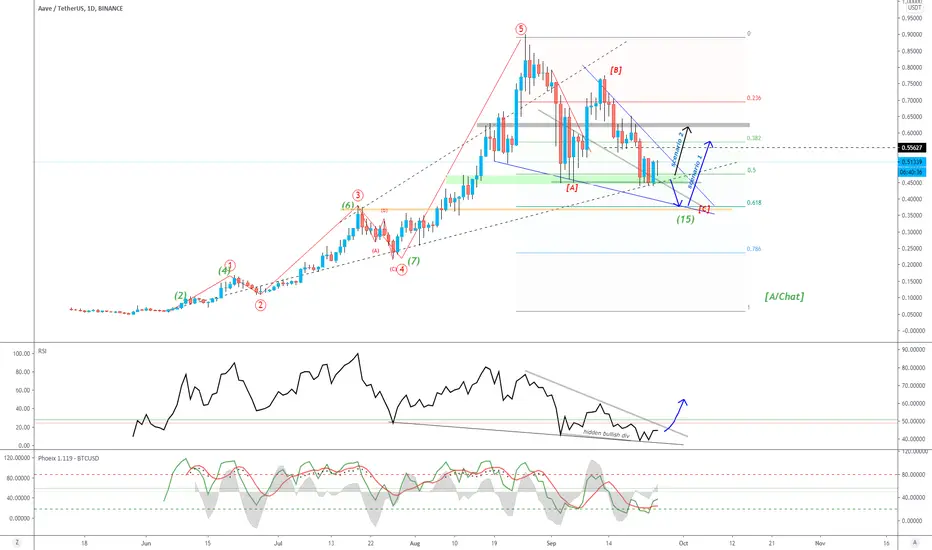
As per the chart, another LIVERMORE cycle completed and I have scenario 1 more likely at this point than scenario 2 with a daily hidden bullish divergence.
Note how the RSI supports scenario 2 so far.
We also have BTC dominance dropping while the ALTs keep driving up.
Please give me a like or tick for this post.
Cheers,
S.SAri.
======================================================================================
12 HRLY chart

======================================================================================
LEND / BTC pairing
12 HRLY chart

DAILY Chart

======================================================================================
PREVIOUS POST
Note: Another chart continuing off from the previous post, link supplied below.
Also note, log disabled on the chart.
As per the chart, another LIVERMORE cycle completed and I have scenario 1 more likely at this point than scenario 2 with a daily hidden bullish divergence.
Note how the RSI supports scenario 2 so far.
We also have BTC dominance dropping while the ALTs keep driving up.
Please give me a like or tick for this post.
Cheers,
S.SAri.
======================================================================================
12 HRLY chart
======================================================================================
LEND / BTC pairing
12 HRLY chart
DAILY Chart
======================================================================================
PREVIOUS POST
Note
I got my scenarios mixed up. Scenario 2 is more likely at this pointTrade active
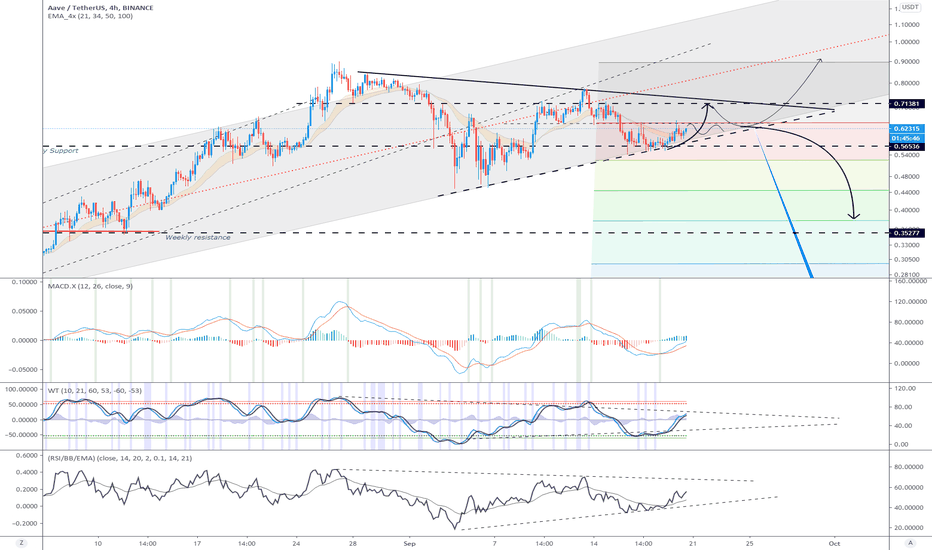
Another possible scenario where we see a bottom reversal formation to go long.With many of the ALTs, we should expect some reversal macro pattern. Hence this hypothesis.
Note
LEND BTC pairing hypothesis, the bottom trend line is critical supportTrade active
Discord: discord.com/invite/vb4hbP88vb (TradeToProspa)
Telegram: t.me/TprospaTradersbot
This community has signals now but with no risk management comms.
Telegram: t.me/TprospaTradersbot
This community has signals now but with no risk management comms.
Related publications
Disclaimer
The information and publications are not meant to be, and do not constitute, financial, investment, trading, or other types of advice or recommendations supplied or endorsed by TradingView. Read more in the Terms of Use.