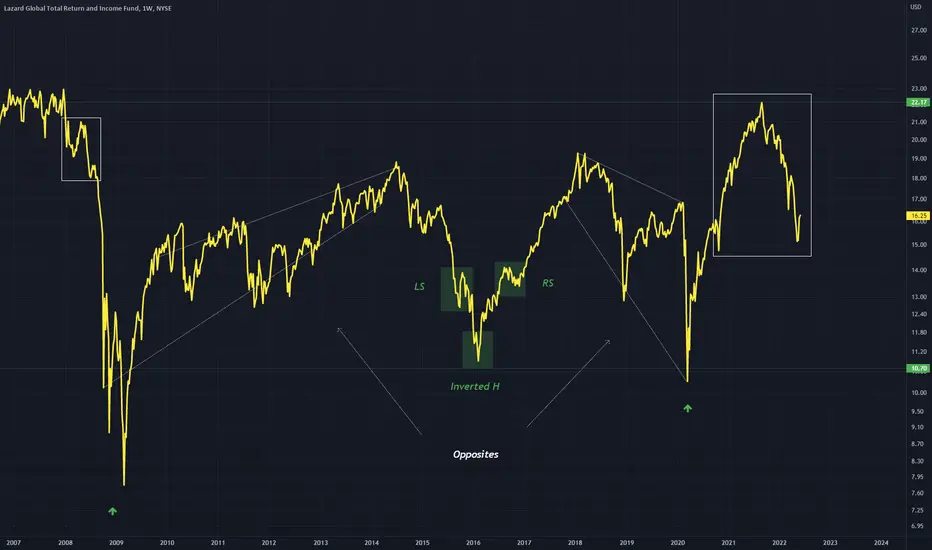
A chart for LGI, price is in a relatively tight range on this Weekly timeframe, it has repeated a chart pattern in an inverted fashion
White rectangle is where we are currently with price and should retest green as it did in the first situation inversely on the first white rectangle
Both are wedge patterns
White rectangle is where we are currently with price and should retest green as it did in the first situation inversely on the first white rectangle
Both are wedge patterns
Disclaimer
The information and publications are not meant to be, and do not constitute, financial, investment, trading, or other types of advice or recommendations supplied or endorsed by TradingView. Read more in the Terms of Use.
Disclaimer
The information and publications are not meant to be, and do not constitute, financial, investment, trading, or other types of advice or recommendations supplied or endorsed by TradingView. Read more in the Terms of Use.