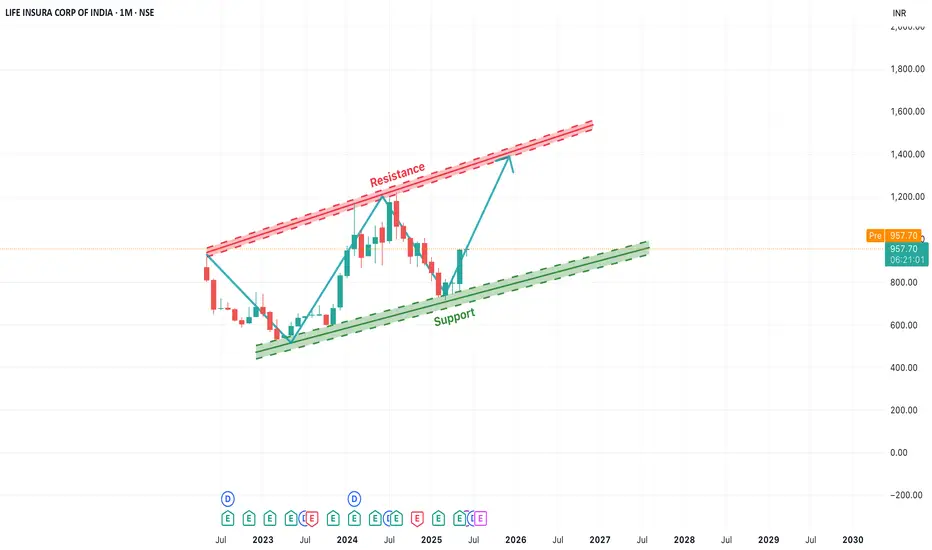
In this monthly chart of LICI, we observe a clear ascending channel pattern forming over the past two years. The price has consistently respected both the support and resistance trendlines, creating a strong bullish structure.
Currently, the stock is bouncing off the lower support trendline, indicating a potential upward move towards the upper resistance zone. This offers a positive long-term outlook, especially if the momentum sustains. The key levels to watch are:
Support Zone: Around ₹850–₹900
Resistance Zone: ₹1250–₹1300
Traders and investors can monitor for a gradual rise toward the resistance level. A breakout beyond this channel may open up new highs, while a breakdown below the support trendline would invalidate the pattern.
📈 Trade Smarter with TradZoo!
🔗 Website: bit.ly/tradzoopage
📣 Telegram: t.me/tradzooIndex
📲 Android App: bit.ly/TradZooApp
📲 Forex App:tradzoo.com/forex/download
🍎 iOS App: bit.ly/TradZoo-iOS-App
🔗 Website: bit.ly/tradzoopage
📣 Telegram: t.me/tradzooIndex
📲 Android App: bit.ly/TradZooApp
📲 Forex App:tradzoo.com/forex/download
🍎 iOS App: bit.ly/TradZoo-iOS-App
Disclaimer
The information and publications are not meant to be, and do not constitute, financial, investment, trading, or other types of advice or recommendations supplied or endorsed by TradingView. Read more in the Terms of Use.