Recently LINKBTC hit the lowest price since May 2019. This was the straw that broke the camels back, so to speak. Chainlink couldn't take it anymore and market conditions are starting to change. We are seeing a full breakdown of a long-term bearish structure, the end of the bearish cycle and downtrend.
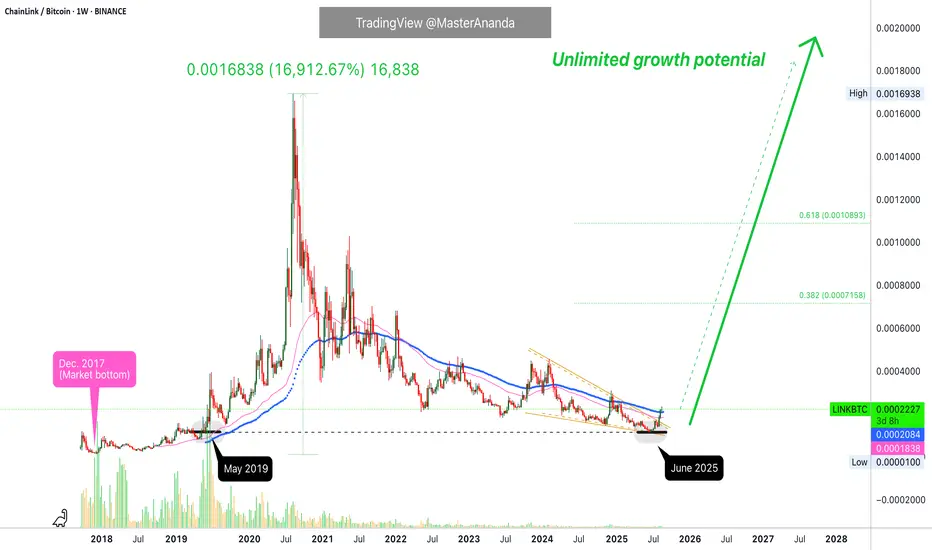
Coincidentally, the same zone that worked as support now happened to be the zone that launched LINKBTC's 2019-2020 major bull market and bullish cycle. A cycle that produced total growth resulting in 16,912%. See the chart:
Here is a closer look at the weekly timeframe:
See how LINKBTC is trading above EMA55 and EMA89 recently, after the lowest prices in more than six years, making this a very strong bullish recovery signal.
A falling wedge pattern has been broken as well with its local downtrend line. If LINKBTC can stay above EMA89 we can expect extraordinary growth. Growth that will not last only a few days or weeks but growth that can last for years or in the least several months.
Look again at this chart. It doesn't say that an entire cycle has to unravel fast, emergency mode in a hurry in two months, no! It doesn't say so. The chart shows bottom prices, an early recovery and plenty of room available for long-term growth. Something similar to 2019-2020. A long-term bull market.
Namaste.
🚨 TOP Results
ETH +2050% · AAVE +1134%
XRP +749% · DOGS +868%
BTC +580% · SOL +687%
t.me/anandatrades/1350
🚨 Analyses & Results
t.me/masteranandatrades/6681
🚨 LIFETIME (7 For the price of 1)
lamatrades.com —Since 2017
ETH +2050% · AAVE +1134%
XRP +749% · DOGS +868%
BTC +580% · SOL +687%
t.me/anandatrades/1350
🚨 Analyses & Results
t.me/masteranandatrades/6681
🚨 LIFETIME (7 For the price of 1)
lamatrades.com —Since 2017
Related publications
Disclaimer
The information and publications are not meant to be, and do not constitute, financial, investment, trading, or other types of advice or recommendations supplied or endorsed by TradingView. Read more in the Terms of Use.