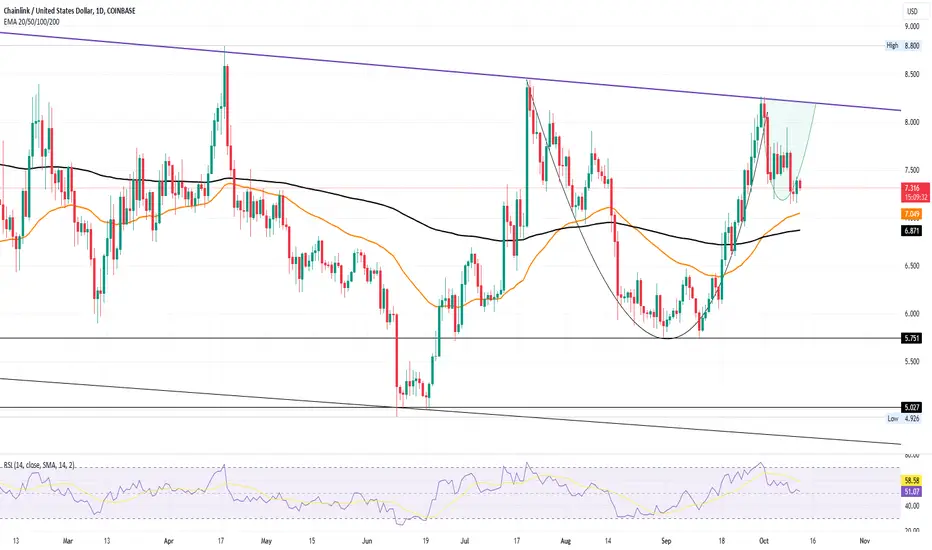
Cup and Handle: LINK forms a potential cup and handle pattern in the daily chart.
Approaching EMA: Downtrend is nearing the 50-day EMA.
Overhead Trendline: LINK struggles to challenge the overhead resistance.
Market Volatility: Uptober rally slower than anticipated.
Golden Crossover: 50 and 200-day EMAs sustain a positive alignment.
RSI Indicator: Sharp downfall from the overbought zone.
Breakout Failure: Intensive supply inflow keeps the trendline intact.
Bearish Reversal: Weekly chart shows a strong bearish reversal.
Higher Low: Possibility of a new higher low within the channel.
Bullish Failure: Rise in selling spree warns of a bullish failure.
Crucial Support: Support levels at $7 and $6.50.
Potential Reversal: Slim chances for buyers to reclaim trend control.
Disclaimer
The information and publications are not meant to be, and do not constitute, financial, investment, trading, or other types of advice or recommendations supplied or endorsed by TradingView. Read more in the Terms of Use.
Disclaimer
The information and publications are not meant to be, and do not constitute, financial, investment, trading, or other types of advice or recommendations supplied or endorsed by TradingView. Read more in the Terms of Use.