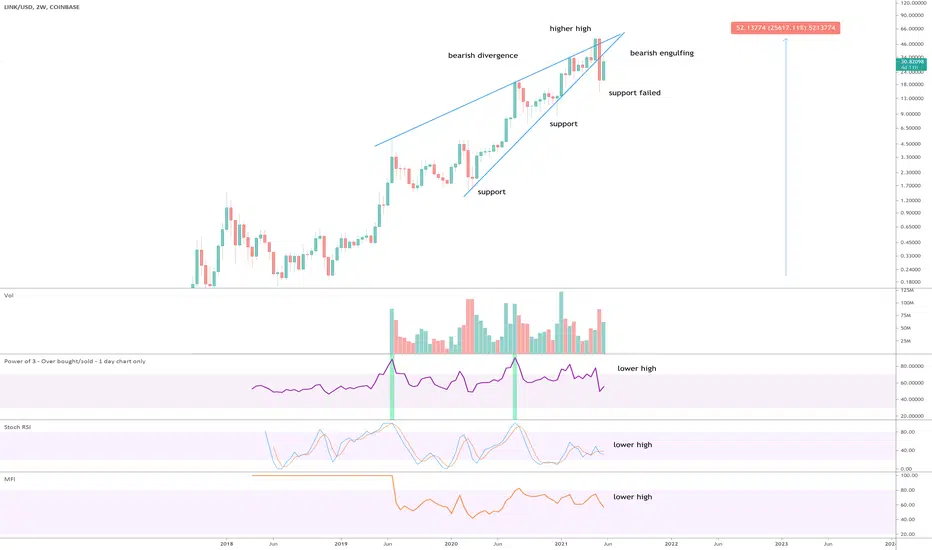
On the above 2-week chart price action has broken out from a rising wedge formation and is currently testing past support as resistance following the printing of a bearish engulfing candle.
A bearish divergence between price action and the oscillators now exists. Not just one of them, all three of them. That is RSI, Stochastic RSI, & MFI. This is significant, especially on this time scale.
Lastly there is the monthly chart below, Stochastic RSI is trending downward (circled in orange) as the bulls failed to push price higher. Bulls are exhausted.
A sell from $50 is amazing if you can get it.
1st target is $16
The idea is void if price action closes above $60 in 2-3 weeks.
Trade active
Trade active
Almost -40% so far. Will revisit once target is reached. If $16 fails, $8 would seem the next likely support, but I'd not bet on it. Wait until confirmation.Trade active
The 5-day chart below shows RSI resistance has now become established and is projected to remain intact for the rest of the year. Very bearish.On the 2-day chart (bottom) the head and shoulders following the bearish divergence this idea began with has confirmed with a break of the neckline.
$18 must hold. If not, next target $3.50
5-day
2-day - head and shoulders breakdown
BTC
bc1q2eckdzh0q8vsd7swcc8et6ze7s99khhxyl7zwy
Weblink: patreon.com/withoutworries
Allow 3-6 months on ideas. Not investment advice. DYOR
bc1q2eckdzh0q8vsd7swcc8et6ze7s99khhxyl7zwy
Weblink: patreon.com/withoutworries
Allow 3-6 months on ideas. Not investment advice. DYOR
Disclaimer
The information and publications are not meant to be, and do not constitute, financial, investment, trading, or other types of advice or recommendations supplied or endorsed by TradingView. Read more in the Terms of Use.