LINK/USDT: A+ Long Setup at Key Support with Daily Oversold
Hello traders,
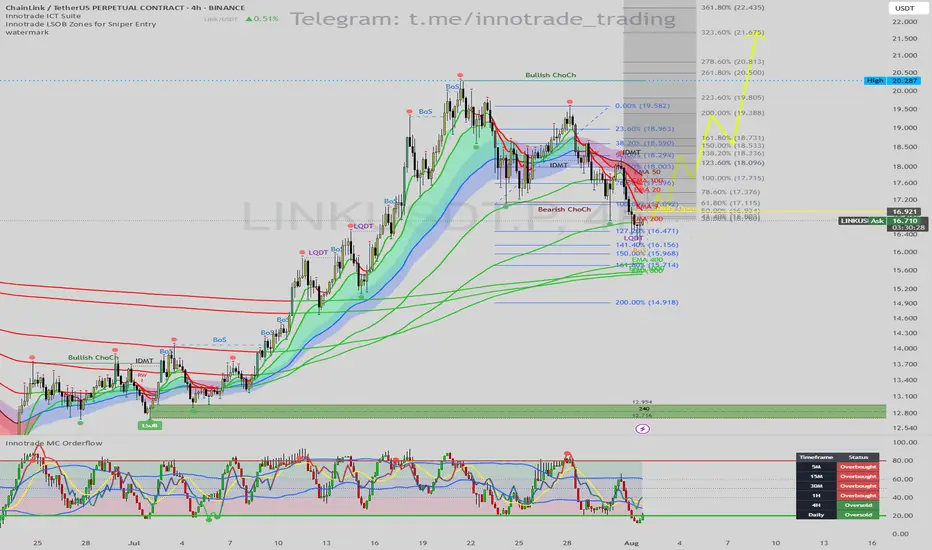
I am monitoring a high-probability long setup on LINK/USDT on the 4H timeframe. The chart is presenting a classic reversal scenario where multiple technical factors are aligning perfectly, suggesting the recent corrective move may be over.
1. Trend & Context (The "Why")
After a strong uptrend, LINK experienced a necessary pullback, confirmed by a Bearish Change of Character (ChoCh). The price has now reached a critical zone where we can anticipate a bullish resumption.
Here are the key confluences for this setup:
Major Dynamic Support: The price is finding strong support directly on the EMA 200, a significant long-term moving average that often marks the end of a correction in a larger uptrend.
Price Action Signal (Liquidity Sweep): The most recent candle performed a perfect Liquidity Sweep (LQDT), wicking below the prior low to take out stop losses before quickly reclaiming the level. This is a classic institutional pattern that often precedes a strong move up.
Momentum Confirmation (MC Orderflow): The momentum oscillator provides the final, high-conviction confirmation:
The MC Orderflow is deep in the OVERSOLD territory, indicating that selling pressure is completely exhausted.
CRITICAL MTF CONFLUENCE: The Multi-Timeframe Cycle Table is showing that both the 4H and Daily timeframes are "Oversold". This HTF alignment is extremely powerful and significantly validates the strength of the reversal signal from this support level.
2. Entry, Stop Loss, and Targets (The "How")
The confluence of these signals provides a clear trade plan with an excellent risk-to-reward profile.
Entry: An entry around the current price ($16.70 - $16.90) is optimal, directly at the EMA 200 support.
Stop Loss (SL): $16.25. This places the stop loss safely below the low of the liquidity sweep wick, providing a clear invalidation point for the trade.
Take Profit (TP) Targets:
TP1: $18.20 (Targeting the cluster of short-term EMAs and the recent consolidation zone).
TP2: $19.50 (The next major swing high resistance).
TP3: $20.28 (The major high of the range, a full trend-reversal target).
Conclusion
This trade presents a textbook "A+" setup. The synergy between a key price action pattern (liquidity sweep) at a major technical level (EMA 200), combined with validated momentum exhaustion on both the 4H and Daily timeframes, creates a very high-probability environment for a significant bullish move.
Disclaimer: This is not financial advice. This analysis is for educational purposes only. Always conduct your own research and manage your risk appropriately.
Disclaimer
The information and publications are not meant to be, and do not constitute, financial, investment, trading, or other types of advice or recommendations supplied or endorsed by TradingView. Read more in the Terms of Use.
Disclaimer
The information and publications are not meant to be, and do not constitute, financial, investment, trading, or other types of advice or recommendations supplied or endorsed by TradingView. Read more in the Terms of Use.