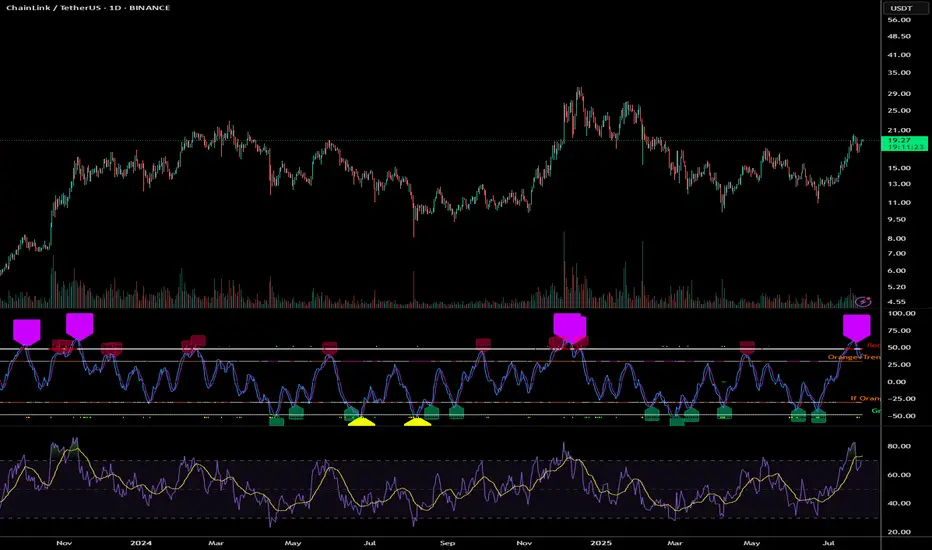
LINK is trading at approximately $19.26. The price has shown significant volatility and upward momentum over the past few months, moving from around $10-11 in early 2025 to the current levels near $19, representing an impressive 80-90% increase.
Technical Indicator Analysis
RSI (Relative Strength Index)
The daily RSI is currently at 61.60, which is in bullish territory but not yet overbought
The 4-hour RSI is showing similar strength at 61.60
This indicates robust momentum without reaching extreme levels that would trigger immediate profit-taking
Historical data shows LINK can sustain RSI readings in the 60-70 range during strong uptrends
Price Action Patterns
LINK has formed a series of higher highs and higher lows since May 2025
The price recently consolidated in the $17-19 range before showing signs of continuation
There was a significant price surge from $13-14 levels to above $19 in mid-July, indicating strong buying pressure
The consolidation after rapid gains suggests healthy market behaviour rather than exhaustion
Volume Analysis
Volume has been increasing during upward price movements
Notable volume spikes occurred during the breakout from $15 to $17 and again during the move above $19
This suggests genuine buying interest rather than a low-volume pump
The Volume-Weighted Average Price (VWAP) continues to slope upward, confirming the strength of the trend
Support and Resistance Levels
Strong support has formed around $17.50-18.00
Previous resistance around $19.00 is now being tested as support
The next major resistance appears to be in the $20-21 range based on previous price action
After that, there's relatively little historical resistance until the $25 level
Fibonacci Projections
Using the recent swing low of approximately $11.45 (May 2025) to the recent high of $19.66:
The 161.8% extension projects a target of approximately $24.70
The 200% extension suggests a move toward $28.00
These Fibonacci levels often serve as magnets for price during strong trend movements
LINK Price Projection
Based on the technical indicators analysed:
Short-term (August-September 2025):
LINK appears poised to break through the $20 psychological barrier
Initial target around $22-23 as the next resistance level
Support should hold around $17.50-18.00 on any pullbacks
The clean break above previous resistance at $18.50-19.00 suggests momentum remains strong
Medium-term (October-November 2025):
If the current trend structure remains intact
LINK could target the $24-25 range, aligning with the 161.8% Fibonacci extension
Previous all-time highs near $30 could come into play by year-end
The steady stair-stepping pattern of rallies followed by consolidation suggests this move would be sustainable
Key Factors to Watch:
Volume on breakouts above $20 and $25
RSI readings for signs of exhaustion or continued strength
Development updates and adoption news specific to Chain-link
Maintenance of the higher lows pattern on any pullbacks
Conclusion
The technical picture for LINK appears bullish, with multiple indicators suggesting continued upward momentum. The price has established a strong uptrend with healthy consolidation periods. The recent price action shows accumulation rather than distribution, with higher lows forming during consolidation phases.
The most likely scenario based on current data suggests LINK could reach the $24-25 range in the next 2-3 months, with potential for movement toward $28-30 by the end of 2025, representing a 30-55% increase from current levels. However, investors should monitor key support levels around $17.50-18.00 for any signs of trend reversal.
The clean chart structure, steady volume profile, and measured RSI readings all point to a continuation of the current uptrend, making LINK's technical outlook decidedly positive for the remainder of 2025.
Discord.gg/CryptoIndicators
Disclaimer
The information and publications are not meant to be, and do not constitute, financial, investment, trading, or other types of advice or recommendations supplied or endorsed by TradingView. Read more in the Terms of Use.
Discord.gg/CryptoIndicators
Disclaimer
The information and publications are not meant to be, and do not constitute, financial, investment, trading, or other types of advice or recommendations supplied or endorsed by TradingView. Read more in the Terms of Use.