⚡️ Technical situation – quick overview
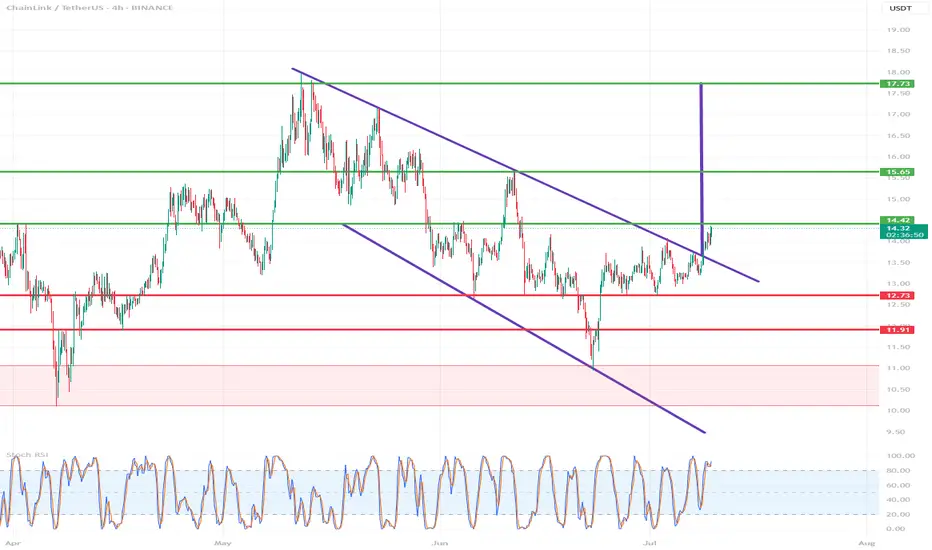
✅ Breakout from the descending channel (purple lines)
✅ Resistance zone 14.42 – currently being tested
✅ Target within the breakout range – around 17.73 USDT
⚠️ Stochastic RSI in the overbought zone – local correction possible
🟪 Descending channel – broken!
The descending channel that has been in place since mid-May has been broken upwards.
Such breakouts often signal a change in the local trend.
Theoretical range of movement = channel height (~3.30 USDT) added to the breakout point (around 14.42) = ~17.73 USDT – perfectly aligned with your resistance level.
🟢 Key Resistance Levels (green):
Level Meaning
14.42 USDT Current tested resistance – psychologically significant
15.65 USDT Local high + June price gap
17.73 USDT Potential target after a breakout – range from the formation
🔴 Support Levels (red):
Level Meaning
12.73 USDT Support from the pre-breakout consolidation
11.91 USDT Key defensive level of the uptrend
11.07 / 10.12 USDT Historical support with strong demand reactions
📉 Stochastic RSI (oscillator):
Currently deep in the overbought zone (above 80).
This may indicate local exhaustion of momentum and a short correction before further upward movement.
However: in strong trends, the RSI may remain high for an extended period – it does not automatically provide a sell signal.
📈 Bullish scenario:
Retest of the 14.42 level as support → confirmation of the breakout
Then a move towards:
15.65 – local stop
17.73 – final target from the channel breakout
🟩 Stop-loss: e.g., below 12.73 USDT (loss of key support)
📉 Bearish scenario:
False breakout and decline below 14.42
Loss of the 12.73 level → possible quick decline to 11.91–11.07
🔴 In this case, a new swing low could open the way to 10.12 USDT.
📌 Summary:
Element Rating
Technical Pattern ✅ Breakout from a descending channel (bullish signal)
Current Level ❗ Test of Key Resistance – Decision Point
RSI (Momentum) ⚠️ Overbought – Correction Possible
Upside Potential (Target) 📈 17.73 USDT
Threat ❌ False breakout and return to below 12.73 USDT
🧠 My suggestion (not investment advice):
Observe the price reaction at 14.42 – if it holds above and consolidation forms → a signal to continue.
If the 4H/1D candle closes below, consider caution, as this could be a bull trap.
Disclaimer
The information and publications are not meant to be, and do not constitute, financial, investment, trading, or other types of advice or recommendations supplied or endorsed by TradingView. Read more in the Terms of Use.
Disclaimer
The information and publications are not meant to be, and do not constitute, financial, investment, trading, or other types of advice or recommendations supplied or endorsed by TradingView. Read more in the Terms of Use.