🧠 Technical Overview:
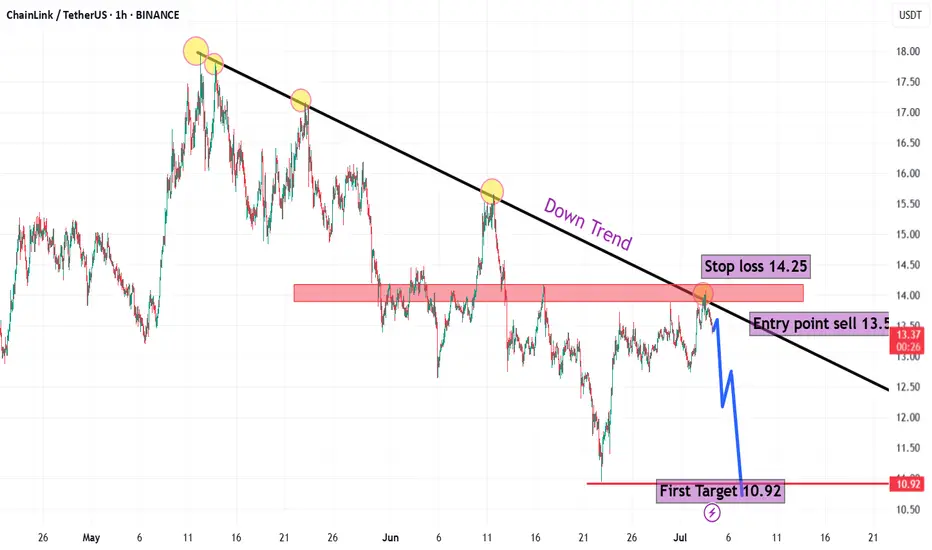
General Trend: The chart shows a clear downtrend starting from mid-May.
Each upward attempt is rejected at the descending trendline, confirming the bearish bias.
🧩 Chart Analysis Elements:
1. Trendline:
Drawn accurately from the major highs, acting as a strong dynamic resistance.
Price has tested this line multiple times and failed to break above it.
2. Supply Zone:
Highlighted in red around the 13.80–14.20 USDT area.
This zone has acted as a strong resistance, causing price to drop again.
3. Entry Point:
Sell at 13.60 USDT, after confirmation of rejection from both the supply zone and the trendline.
4. Stop Loss:
Set at 14.25 USDT, above both the resistance zone and the descending trendline — a logical level to protect the trade.
5. First Target:
10.92 USDT, a clearly identified support level.
This target reflects a likely corrective move within the ongoing downtrend.
📉 Expected Price Action:
Current price is 13.38 USDT, very close to the suggested entry.
If rejection continues from this area, the price is expected to gradually decline toward the 10.92 support level.
The price structure suggests a potential formation of a new lower low.
🔥 Risk-to-Reward Ratio (R:R):
Target: ~2.68 USDT (from 13.60 to 10.92)
Stop Loss: ~0.65 USDT (from 13.60 to 14.25)
R:R = ~4.1:1 → Excellent reward compared to risk.
✅ Conclusion:
The proposed short (sell) trade setup is technically solid and aligns with the broader downtrend.
Classic confirmations: Trendline rejection + Supply Zone resistance + Bearish price action.
Well-placed stop loss and logical support-based target.
Suitable for day traders and swing traders.
Disclaimer
The information and publications are not meant to be, and do not constitute, financial, investment, trading, or other types of advice or recommendations supplied or endorsed by TradingView. Read more in the Terms of Use.
Disclaimer
The information and publications are not meant to be, and do not constitute, financial, investment, trading, or other types of advice or recommendations supplied or endorsed by TradingView. Read more in the Terms of Use.