Hello Crypto Lovers,
Mars Signals team wishes you high profits.
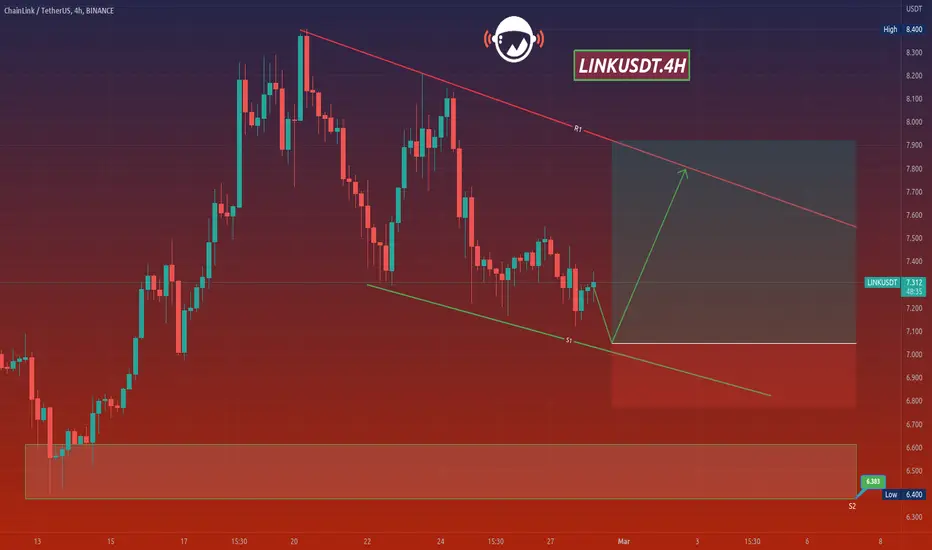
This is a 4-hour-time frame analysis for LINKUSDT
There is R1 on the top of the chart which is a resistance area and it represents the unsuccessful triumphs of the price to rise at several points. And as you see, S1 and S2 are our support areas with their well support of price for various points. Hence, we observe the fluctuation of price in a flag-shaped pattern; consisting R1 as the top part of the flag and S1 as the bottom part. So the price is fluctuating over S1 after its little rise toward this area. Our expectation would include more decline for the price to reach S1 and then via having some rising signs, there would be more rise predicted for the price to reach higher amounts. You should know that if the price loses the support and falls below S1, more decline would happen to it then. Do not forget to consider the market situation in lower time frames and then decide what to do; based on the multiple pieces of information which you would obtain from our analyses and updates.
Warning: This is just a suggestion and we do not guarantee profits. We advise you to analyze the chart before opening any positions.
Wish you luck
Mars Signals team wishes you high profits.
This is a 4-hour-time frame analysis for LINKUSDT
There is R1 on the top of the chart which is a resistance area and it represents the unsuccessful triumphs of the price to rise at several points. And as you see, S1 and S2 are our support areas with their well support of price for various points. Hence, we observe the fluctuation of price in a flag-shaped pattern; consisting R1 as the top part of the flag and S1 as the bottom part. So the price is fluctuating over S1 after its little rise toward this area. Our expectation would include more decline for the price to reach S1 and then via having some rising signs, there would be more rise predicted for the price to reach higher amounts. You should know that if the price loses the support and falls below S1, more decline would happen to it then. Do not forget to consider the market situation in lower time frames and then decide what to do; based on the multiple pieces of information which you would obtain from our analyses and updates.
Warning: This is just a suggestion and we do not guarantee profits. We advise you to analyze the chart before opening any positions.
Wish you luck
Disclaimer
The information and publications are not meant to be, and do not constitute, financial, investment, trading, or other types of advice or recommendations supplied or endorsed by TradingView. Read more in the Terms of Use.
Disclaimer
The information and publications are not meant to be, and do not constitute, financial, investment, trading, or other types of advice or recommendations supplied or endorsed by TradingView. Read more in the Terms of Use.