The RSI chart has entered the overbought zone (4H and 1H TFs)
Price movement and RSI indicate the formation of a bearish divergence (1H and 30m TFs)
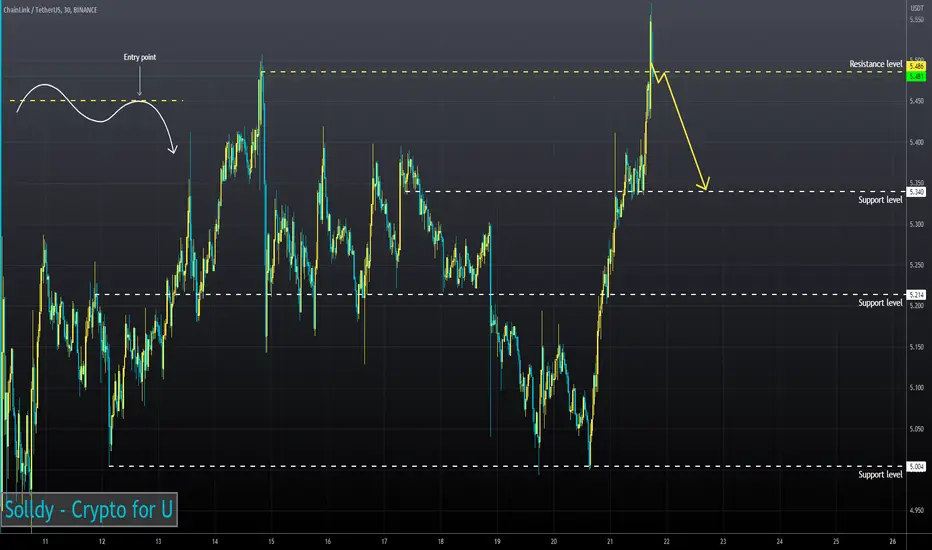
The asset will correct if it fixes under resistance.
Price movement and RSI indicate the formation of a bearish divergence (1H and 30m TFs)
The asset will correct if it fixes under resistance.
Disclaimer
The information and publications are not meant to be, and do not constitute, financial, investment, trading, or other types of advice or recommendations supplied or endorsed by TradingView. Read more in the Terms of Use.
Disclaimer
The information and publications are not meant to be, and do not constitute, financial, investment, trading, or other types of advice or recommendations supplied or endorsed by TradingView. Read more in the Terms of Use.