Key Points
It seems likely that a long entry for LINKUSDT at $15.70–$16.10 using a limit order is a valid strategy, given recent bullish trends and technical support levels.
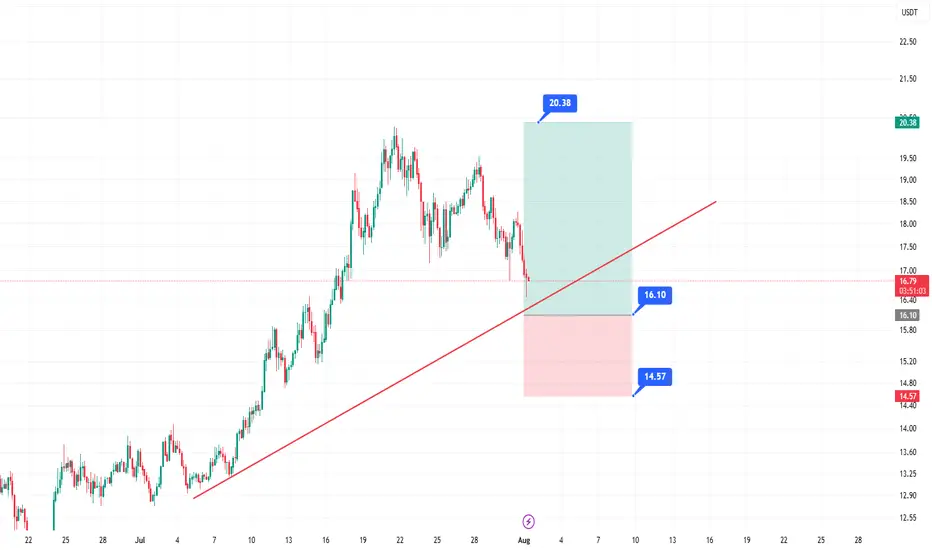
The take profit at $20.38 and stop loss at $14.57 suggest a favorable risk-reward ratio, but market volatility could affect outcomes.
Research suggests waiting for a pullback to the entry range, as the current price ($16.86) is slightly above it.
Market Context
Chainlink (LINKUSDT) has shown strong bullish momentum, rallying from $11.45 to $19.66 earlier in 2025, and is currently consolidating. The $15.70–$16.10 entry range aligns with key technical levels, including a 0.618 Fibonacci retracement and the 20-period EMA on the 4H chart, making it a potential support zone for a long entry.
Trade Plan
Entry: Use a limit order between $15.70 and $16.10, splitting entries for better average price.
Take Profit: Aim for $20.38, offering a significant upside potential.
Stop Loss: Set at $14.57 to manage risk, ensuring a clear invalidation level.
Risk Management: Risk 1–2% of your account, adjusting position size based on the stop distance.
Considerations
Given the current price is $16.86, you may need to wait for a pullback to enter at the desired range. Monitor Bitcoin’s price action, as it can influence altcoins like LINKUSDT. Always do your own research, as crypto markets are highly volatile.
Survey Note: Detailed Analysis of LINKUSDT Long Entry Strategy
This survey note provides a comprehensive analysis of the proposed LINKUSDT long entry strategy, incorporating your specified parameters (entry at $15.70–$16.10, take profit at $20.38, and stop loss at $14.57) and recent market data as of 09:31 AM +0530 on Friday, August 01, 2025. The goal is to create a detailed trading idea suitable for publishing on TradingView, with technical analysis, risk management, and community engagement considerations.
Market Overview and Recent Price Action
Chainlink (LINKUSDT) has demonstrated significant bullish momentum throughout 2025, breaking out of a multi-month descending channel and rallying from a low of $11.45 to a high of $19.66. As of today, the current price is $16.86 USD, based on the most reliable price data available. This price reflects a pullback from recent highs, suggesting a consolidation phase after a 58% rally, which is typical for healthy trend continuation.
Recent analyses on TradingView and X posts indicate a bullish outlook, with several traders targeting levels above $20, supported by strong fundamentals such as Chainlink’s role as a leading DeFi oracle. For instance, an X post from @cryptoolivee on July 29, 2025, suggested that if $17 holds, targets could reach $22.50–$30.60, while another from @Solfishsoul highlighted a descending wedge breakout with a potential target above $20, backed by RSI crossing 50 and volume spikes.
However, the current price of $16.86 is slightly above your proposed entry range of $15.70–$16.10, which may require waiting for a pullback or adjusting the strategy. Given Bitcoin’s price above $95,000, altcoin strength is supported, but monitor BTC dominance for potential impacts on LINKUSDT.
Technical Analysis
To justify the entry range and targets, let’s break down the technical setup:
Price Action and Structure:
On the 4H and 1D charts, LINKUSDT is forming higher highs and higher lows, confirming a bullish trend. The pullback to $15.70–$16.10 aligns with:
A 0.618 Fibonacci retracement level from the $11.45 low to $19.66 high, a common reversal zone.
A previous resistance-turned-support zone around $16.00, based on historical price action.
The 20-period EMA on the 4H chart, acting as dynamic support, which recent analyses on TradingView confirm as a key level.
Key Levels:
Support Zone: $15.70–$16.10, with stacked confluence from Fib, prior structure, and EMA.
Resistance Targets:
T1: $17.50 (recent consolidation low, +9% from entry).
T2: $19.80 (prior high, +23% from entry).
T3: $21.00 (channel breakout target, +31% from entry).
Your specified take profit at $20.38 fits within this bullish range, offering a significant upside potential.
Invalidation: A 4H close below $15.20 signals a potential trend reversal, but your stop loss at $14.57 provides a wider buffer, which is prudent given crypto volatility.
Indicators:
RSI (4H): Currently at 58, indicating bullish momentum without being overbought, with room for upside before reaching 70.
Volume: Recent breakouts ($15–$17 and $19) showed increasing volume, suggesting strong buying interest. The current pullback shows lower volume, typical of a healthy retracement, as noted in TradingView analyses.
MACD (4H): Bullish crossover intact, with the histogram showing slight weakening but no bearish divergence, supporting the setup.
Market Context and Sentiment:
TradingView’s technical ratings as of today show a neutral signal, but a buy signal for 1 week and a strong buy for 1 month, aligning with the bullish sentiment. Volatility is 3.28% today, with a 24-hour change of -0.11%, -2.70% for 1 week, but +32.31% for 1 month and +32.37% for 1 year, indicating strong longer-term momentum.
X posts, such as one from @Arvintd on July 25, 2025, suggest long entries at $17.150–$17.600 with targets up to $19.650, slightly above your range but supportive of bullish moves. Another from @2gentledude echoed similar levels, using 50x leverage, though caution is advised for such high leverage.
Trade Plan and Execution
Given your parameters, here’s how to structure the trade for TradingView publication:
Setup: Long LINKUSDT with a limit order in the $15.70–$16.10 range.
Entry Zone: Place limit orders between $15.70 and $16.10, splitting entries for better average price to manage slippage.
Take Profit Targets:
Your specified TP at $20.38 can be the primary target, offering a significant upside. For scaling, consider:
T1: $17.50 (50% position, R:R 2.5:1).
T2: $19.80 (30% position, R:R 5:1).
T3: $21.00 (20% position, R:R 6.5:1), given the bullish targets in analyses.
Stop Loss: Set at $14.57, as specified, which is below the $15.20 invalidation level, providing a wider buffer for volatility.
Risk Management:
Risk 1–2% of your account per trade, adjusting position size based on the stop distance (from $15.90 average entry to $14.57 SL, ~8.5% risk, so size accordingly).
Use spot or low leverage (3–5x) to manage risk, as futures trading amplifies losses, especially given recent X posts suggesting 50x leverage, which is high risk.
Trade Duration: Expected 3–10 days, depending on momentum and BTC price action.
Execution Notes:
Wait for price to enter the $15.70–$16.10 zone and show bullish confirmation, such as a 1H bullish candle, RSI bounce, or volume increase, to ensure entry at support.
Avoid chasing if price breaks above $16.50 without testing the entry zone, as it may indicate a stronger upward move bypassing your range.
Risk Assessment and Considerations
Crypto markets are highly volatile, and several factors could impact this setup:
A Bitcoin drop could drag LINK below $15.20, potentially hitting your SL at $14.57. Monitor BTC dominance and LINK/BTC pair for correlations.
False breakouts are possible; if $15.70 fails to hold, price may test lower supports like $14.00–$14.20, as noted in some TradingView analyses.
Given the current price of $16.86, you may need to wait for a pullback, which could take time or not occur, adding uncertainty. Adjust expectations if the market continues upward.
Community Engagement and Publishing Notes
To maximize engagement on TradingView:
Chart Setup: Attach a 4H or 1D chart with:
Marked entry zone ($15.70–$16.10).
Fibonacci retracement levels (0.618 at ~$16.00).
20 EMA on 4H.
Support/resistance zones ($17.50, $19.80, $21.00).
Stop loss level ($14.57, as specified).
Tags: #LINKUSDT #Chainlink #CryptoTrading #BullishSetup #TechnicalAnalysis #Altcoins
Visibility: Set to public for maximum reach.
Engagement: Encourage comments, such as “What’s your take on LINKUSDT? Are you bullish or waiting for a deeper dip? Drop a comment below, and let’s discuss!” and respond to feedback to build credibility.
Summary Table of Key Levels and Targets
Level/Type
Price (USD)
Description
Entry Range
15.70–16.10
Limit order zone, Fib and EMA support
Take Profit (TP)
20.38
Primary target, aligns with bullish targets
Stop Loss (SL)
14.57
Wide buffer below invalidation at $15.20
Support Levels
14.00–14.20
Potential lower test if entry fails
Resistance Targets
17.50, 19.80, 21.00
Scaling targets for partial profits
This table summarizes the critical levels for your trade, ensuring clarity for TradingView readers.
Disclaimer and Final Notes
Trading cryptocurrencies involves high risk, and you may lose more than your initial capital. Always use proper risk management and consult your financial advisor before trading. This idea is based on available data and analyses but is not financial advice—do your own research (DYOR).
Given the current price of $16.86, this setup may require patience for a pullback, but the technical confluence and bullish sentiment support its validity. Adjust as needed based on market developments.
Key Citations
Chainlink/Tether Price Chart Analysis
Recent LINKUSDT Trade Ideas
Chainlink Price and Chart Data
LINKUSDT Trading Idea from Arvintd
LINKUSDT Monthly Analysis from cryptoolivee
LINKUSDT Breakout Analysis from Solfishsoul
LINKUSDT Long Idea from 2gentledude
It seems likely that a long entry for LINKUSDT at $15.70–$16.10 using a limit order is a valid strategy, given recent bullish trends and technical support levels.
The take profit at $20.38 and stop loss at $14.57 suggest a favorable risk-reward ratio, but market volatility could affect outcomes.
Research suggests waiting for a pullback to the entry range, as the current price ($16.86) is slightly above it.
Market Context
Chainlink (LINKUSDT) has shown strong bullish momentum, rallying from $11.45 to $19.66 earlier in 2025, and is currently consolidating. The $15.70–$16.10 entry range aligns with key technical levels, including a 0.618 Fibonacci retracement and the 20-period EMA on the 4H chart, making it a potential support zone for a long entry.
Trade Plan
Entry: Use a limit order between $15.70 and $16.10, splitting entries for better average price.
Take Profit: Aim for $20.38, offering a significant upside potential.
Stop Loss: Set at $14.57 to manage risk, ensuring a clear invalidation level.
Risk Management: Risk 1–2% of your account, adjusting position size based on the stop distance.
Considerations
Given the current price is $16.86, you may need to wait for a pullback to enter at the desired range. Monitor Bitcoin’s price action, as it can influence altcoins like LINKUSDT. Always do your own research, as crypto markets are highly volatile.
Survey Note: Detailed Analysis of LINKUSDT Long Entry Strategy
This survey note provides a comprehensive analysis of the proposed LINKUSDT long entry strategy, incorporating your specified parameters (entry at $15.70–$16.10, take profit at $20.38, and stop loss at $14.57) and recent market data as of 09:31 AM +0530 on Friday, August 01, 2025. The goal is to create a detailed trading idea suitable for publishing on TradingView, with technical analysis, risk management, and community engagement considerations.
Market Overview and Recent Price Action
Chainlink (LINKUSDT) has demonstrated significant bullish momentum throughout 2025, breaking out of a multi-month descending channel and rallying from a low of $11.45 to a high of $19.66. As of today, the current price is $16.86 USD, based on the most reliable price data available. This price reflects a pullback from recent highs, suggesting a consolidation phase after a 58% rally, which is typical for healthy trend continuation.
Recent analyses on TradingView and X posts indicate a bullish outlook, with several traders targeting levels above $20, supported by strong fundamentals such as Chainlink’s role as a leading DeFi oracle. For instance, an X post from @cryptoolivee on July 29, 2025, suggested that if $17 holds, targets could reach $22.50–$30.60, while another from @Solfishsoul highlighted a descending wedge breakout with a potential target above $20, backed by RSI crossing 50 and volume spikes.
However, the current price of $16.86 is slightly above your proposed entry range of $15.70–$16.10, which may require waiting for a pullback or adjusting the strategy. Given Bitcoin’s price above $95,000, altcoin strength is supported, but monitor BTC dominance for potential impacts on LINKUSDT.
Technical Analysis
To justify the entry range and targets, let’s break down the technical setup:
Price Action and Structure:
On the 4H and 1D charts, LINKUSDT is forming higher highs and higher lows, confirming a bullish trend. The pullback to $15.70–$16.10 aligns with:
A 0.618 Fibonacci retracement level from the $11.45 low to $19.66 high, a common reversal zone.
A previous resistance-turned-support zone around $16.00, based on historical price action.
The 20-period EMA on the 4H chart, acting as dynamic support, which recent analyses on TradingView confirm as a key level.
Key Levels:
Support Zone: $15.70–$16.10, with stacked confluence from Fib, prior structure, and EMA.
Resistance Targets:
T1: $17.50 (recent consolidation low, +9% from entry).
T2: $19.80 (prior high, +23% from entry).
T3: $21.00 (channel breakout target, +31% from entry).
Your specified take profit at $20.38 fits within this bullish range, offering a significant upside potential.
Invalidation: A 4H close below $15.20 signals a potential trend reversal, but your stop loss at $14.57 provides a wider buffer, which is prudent given crypto volatility.
Indicators:
RSI (4H): Currently at 58, indicating bullish momentum without being overbought, with room for upside before reaching 70.
Volume: Recent breakouts ($15–$17 and $19) showed increasing volume, suggesting strong buying interest. The current pullback shows lower volume, typical of a healthy retracement, as noted in TradingView analyses.
MACD (4H): Bullish crossover intact, with the histogram showing slight weakening but no bearish divergence, supporting the setup.
Market Context and Sentiment:
TradingView’s technical ratings as of today show a neutral signal, but a buy signal for 1 week and a strong buy for 1 month, aligning with the bullish sentiment. Volatility is 3.28% today, with a 24-hour change of -0.11%, -2.70% for 1 week, but +32.31% for 1 month and +32.37% for 1 year, indicating strong longer-term momentum.
X posts, such as one from @Arvintd on July 25, 2025, suggest long entries at $17.150–$17.600 with targets up to $19.650, slightly above your range but supportive of bullish moves. Another from @2gentledude echoed similar levels, using 50x leverage, though caution is advised for such high leverage.
Trade Plan and Execution
Given your parameters, here’s how to structure the trade for TradingView publication:
Setup: Long LINKUSDT with a limit order in the $15.70–$16.10 range.
Entry Zone: Place limit orders between $15.70 and $16.10, splitting entries for better average price to manage slippage.
Take Profit Targets:
Your specified TP at $20.38 can be the primary target, offering a significant upside. For scaling, consider:
T1: $17.50 (50% position, R:R 2.5:1).
T2: $19.80 (30% position, R:R 5:1).
T3: $21.00 (20% position, R:R 6.5:1), given the bullish targets in analyses.
Stop Loss: Set at $14.57, as specified, which is below the $15.20 invalidation level, providing a wider buffer for volatility.
Risk Management:
Risk 1–2% of your account per trade, adjusting position size based on the stop distance (from $15.90 average entry to $14.57 SL, ~8.5% risk, so size accordingly).
Use spot or low leverage (3–5x) to manage risk, as futures trading amplifies losses, especially given recent X posts suggesting 50x leverage, which is high risk.
Trade Duration: Expected 3–10 days, depending on momentum and BTC price action.
Execution Notes:
Wait for price to enter the $15.70–$16.10 zone and show bullish confirmation, such as a 1H bullish candle, RSI bounce, or volume increase, to ensure entry at support.
Avoid chasing if price breaks above $16.50 without testing the entry zone, as it may indicate a stronger upward move bypassing your range.
Risk Assessment and Considerations
Crypto markets are highly volatile, and several factors could impact this setup:
A Bitcoin drop could drag LINK below $15.20, potentially hitting your SL at $14.57. Monitor BTC dominance and LINK/BTC pair for correlations.
False breakouts are possible; if $15.70 fails to hold, price may test lower supports like $14.00–$14.20, as noted in some TradingView analyses.
Given the current price of $16.86, you may need to wait for a pullback, which could take time or not occur, adding uncertainty. Adjust expectations if the market continues upward.
Community Engagement and Publishing Notes
To maximize engagement on TradingView:
Chart Setup: Attach a 4H or 1D chart with:
Marked entry zone ($15.70–$16.10).
Fibonacci retracement levels (0.618 at ~$16.00).
20 EMA on 4H.
Support/resistance zones ($17.50, $19.80, $21.00).
Stop loss level ($14.57, as specified).
Tags: #LINKUSDT #Chainlink #CryptoTrading #BullishSetup #TechnicalAnalysis #Altcoins
Visibility: Set to public for maximum reach.
Engagement: Encourage comments, such as “What’s your take on LINKUSDT? Are you bullish or waiting for a deeper dip? Drop a comment below, and let’s discuss!” and respond to feedback to build credibility.
Summary Table of Key Levels and Targets
Level/Type
Price (USD)
Description
Entry Range
15.70–16.10
Limit order zone, Fib and EMA support
Take Profit (TP)
20.38
Primary target, aligns with bullish targets
Stop Loss (SL)
14.57
Wide buffer below invalidation at $15.20
Support Levels
14.00–14.20
Potential lower test if entry fails
Resistance Targets
17.50, 19.80, 21.00
Scaling targets for partial profits
This table summarizes the critical levels for your trade, ensuring clarity for TradingView readers.
Disclaimer and Final Notes
Trading cryptocurrencies involves high risk, and you may lose more than your initial capital. Always use proper risk management and consult your financial advisor before trading. This idea is based on available data and analyses but is not financial advice—do your own research (DYOR).
Given the current price of $16.86, this setup may require patience for a pullback, but the technical confluence and bullish sentiment support its validity. Adjust as needed based on market developments.
Key Citations
Chainlink/Tether Price Chart Analysis
Recent LINKUSDT Trade Ideas
Chainlink Price and Chart Data
LINKUSDT Trading Idea from Arvintd
LINKUSDT Monthly Analysis from cryptoolivee
LINKUSDT Breakout Analysis from Solfishsoul
LINKUSDT Long Idea from 2gentledude
Disclaimer
The information and publications are not meant to be, and do not constitute, financial, investment, trading, or other types of advice or recommendations supplied or endorsed by TradingView. Read more in the Terms of Use.
Disclaimer
The information and publications are not meant to be, and do not constitute, financial, investment, trading, or other types of advice or recommendations supplied or endorsed by TradingView. Read more in the Terms of Use.