IN weekly time frame Link has downsloping trend line. if it breaks then we can have bullish trend in Link
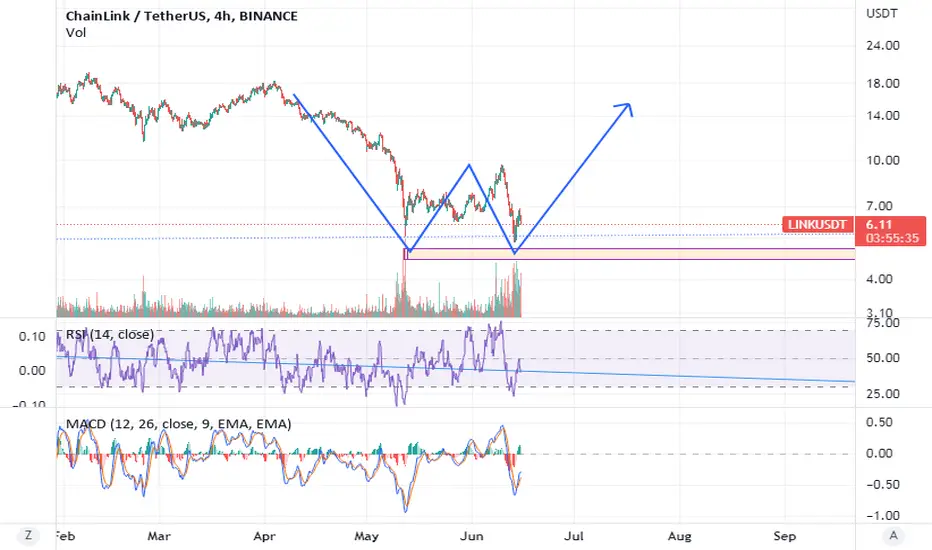
In 4h time frame it has double bottom chart and it can rise again if Bitcoin can keep itself on the top of 22500
In 4h time frame it has double bottom chart and it can rise again if Bitcoin can keep itself on the top of 22500
Disclaimer
The information and publications are not meant to be, and do not constitute, financial, investment, trading, or other types of advice or recommendations supplied or endorsed by TradingView. Read more in the Terms of Use.
Disclaimer
The information and publications are not meant to be, and do not constitute, financial, investment, trading, or other types of advice or recommendations supplied or endorsed by TradingView. Read more in the Terms of Use.