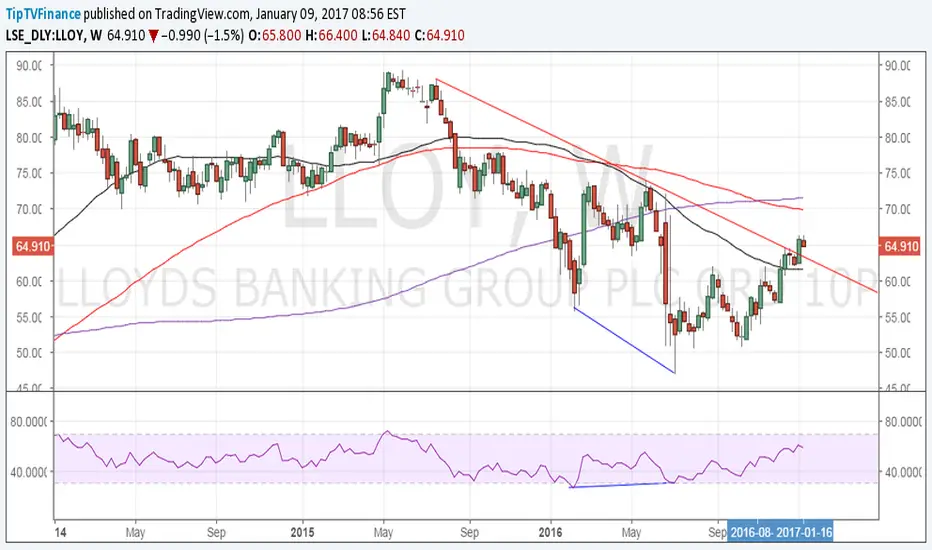
First it was the bullish price RSI divergence and now we have a confirmation of the breach of the falling trend line on the weekly chart. The weekly 50-MA is bottoming out as well.
The stock appears on track to test 70.00 levels. Bullish invalidation is seen only if the stock closes on Friday below the weekly 50-MA level of 61.53.
The stock appears on track to test 70.00 levels. Bullish invalidation is seen only if the stock closes on Friday below the weekly 50-MA level of 61.53.
Related publications
Disclaimer
The information and publications are not meant to be, and do not constitute, financial, investment, trading, or other types of advice or recommendations supplied or endorsed by TradingView. Read more in the Terms of Use.
Related publications
Disclaimer
The information and publications are not meant to be, and do not constitute, financial, investment, trading, or other types of advice or recommendations supplied or endorsed by TradingView. Read more in the Terms of Use.