Eli Lilly remains fundamentally strong, with robust growth in revenue (+45% YoY), driven by weight-loss and diabetes drugs like Mounjaro and Zepbound. Despite this, the stock saw a recent pullback after a lowered FY25 profit outlook.
Technical View:
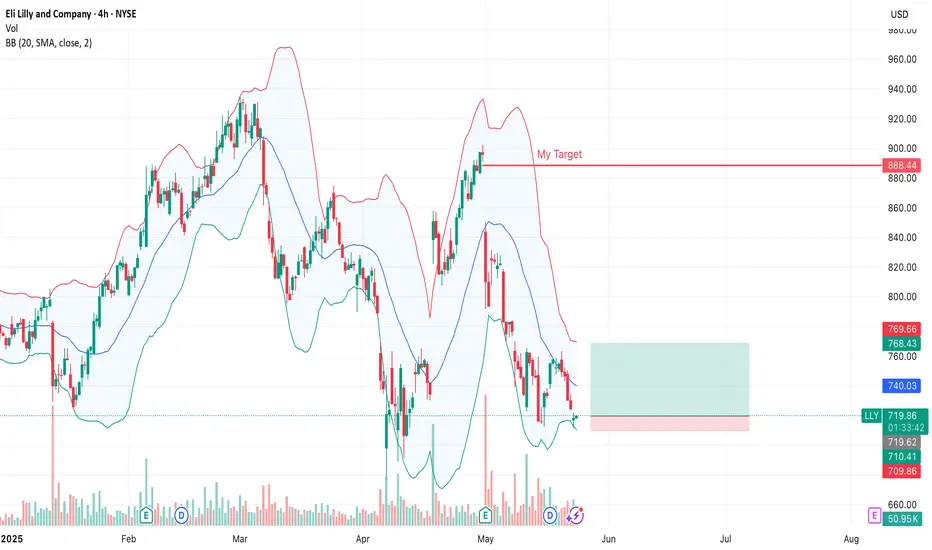
LLY is trading near a key support zone around $710. The setup offers a favorable 1:5 risk/reward ratio, with a stop at $700.86 and a target near $768. Bollinger Bands are tightening, indicating a potential breakout.
This decline could be partially driven by market caution ahead of the upcoming FOMC meeting in June. If support holds, we may see a bounce toward the $760–770 area.
Plan:
Entry: ~$710
Target: ~$768
Stop: ~$700.86
Risk/Reward: 1:5
Watching price action closely near the lower Bollinger band.
Trade closed: target reached
Disclaimer
The information and publications are not meant to be, and do not constitute, financial, investment, trading, or other types of advice or recommendations supplied or endorsed by TradingView. Read more in the Terms of Use.
Disclaimer
The information and publications are not meant to be, and do not constitute, financial, investment, trading, or other types of advice or recommendations supplied or endorsed by TradingView. Read more in the Terms of Use.