Red Pill first - let’s stick to some harsh realities, but using technical analysis only.
Why the harsh crash?
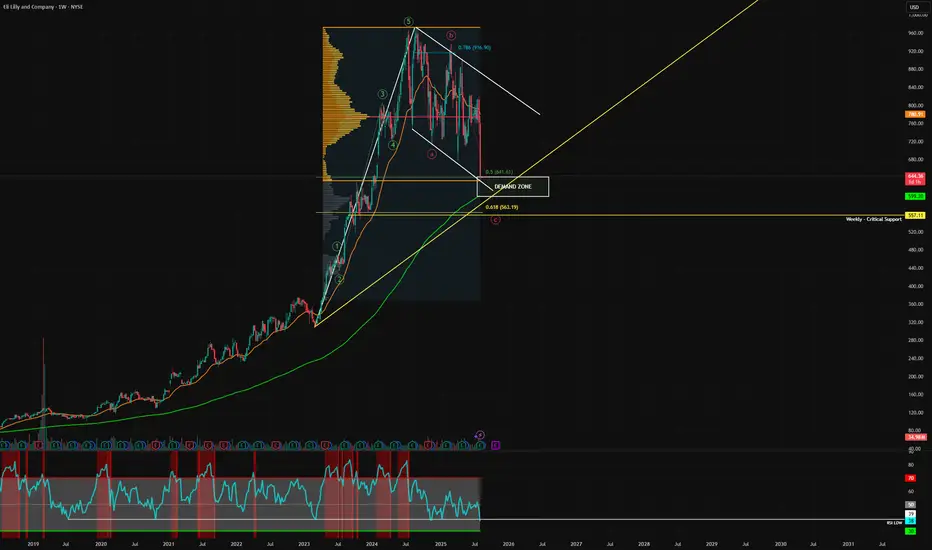
We were rejected at the Value Area high at $972, followed by another rejection at the 0.786 Fibonacci level at $916, along with the top of the flag pattern of this giant bull flag. This was an epic short for those that took it, strong technical confluence.
We then began consolidating before another rejection of the POC - $776, we also lost the 21 week moving average. The rejection was on a large volume candle - so the bears are firmly in control, for now. This is a pivotal point since Lily had claimed the 21 week moving average in December 2020, and it was only just lost. Not good.
Blue Pill - is there hope? I think so. In my opinion this is a giant bull flag pattern and eventually Eli Lilly will break all time highs, but that will take time to play out. Don't be mistaken, the bears are in full control. But we are now sitting on the first line of support - the 0.5 Fibonacci level at $641 and the VAL - so far we are holding. Is this the optimal entry for new longs? It's not a bad place to start building a position, if you want to be extremely aggressive. We have just dipped into my DEMAND ZONE box.
Waiting for lower? Well that is likely given the downtrend volume. We could get an optimal entry between $557 to $599. We have a strong confluence of the 200 week moving average and the golden ratio pocket. I don't think we will lose the critical weekly support level, but if that is lost there isn't a lot of support below. I do firmly believe institutions will be stepping in here and buying aggressively. Of course a recession will change everything, but we are not there yet.
So there's reasons to be optimistic for long term holders buying on dips, but don't expect a swift recovery.
Not financial advice, always do what's best for you. Keep a close eye on this chart
Why the harsh crash?
We were rejected at the Value Area high at $972, followed by another rejection at the 0.786 Fibonacci level at $916, along with the top of the flag pattern of this giant bull flag. This was an epic short for those that took it, strong technical confluence.
We then began consolidating before another rejection of the POC - $776, we also lost the 21 week moving average. The rejection was on a large volume candle - so the bears are firmly in control, for now. This is a pivotal point since Lily had claimed the 21 week moving average in December 2020, and it was only just lost. Not good.
Blue Pill - is there hope? I think so. In my opinion this is a giant bull flag pattern and eventually Eli Lilly will break all time highs, but that will take time to play out. Don't be mistaken, the bears are in full control. But we are now sitting on the first line of support - the 0.5 Fibonacci level at $641 and the VAL - so far we are holding. Is this the optimal entry for new longs? It's not a bad place to start building a position, if you want to be extremely aggressive. We have just dipped into my DEMAND ZONE box.
Waiting for lower? Well that is likely given the downtrend volume. We could get an optimal entry between $557 to $599. We have a strong confluence of the 200 week moving average and the golden ratio pocket. I don't think we will lose the critical weekly support level, but if that is lost there isn't a lot of support below. I do firmly believe institutions will be stepping in here and buying aggressively. Of course a recession will change everything, but we are not there yet.
So there's reasons to be optimistic for long term holders buying on dips, but don't expect a swift recovery.
Not financial advice, always do what's best for you. Keep a close eye on this chart
Disclaimer
The information and publications are not meant to be, and do not constitute, financial, investment, trading, or other types of advice or recommendations supplied or endorsed by TradingView. Read more in the Terms of Use.
Disclaimer
The information and publications are not meant to be, and do not constitute, financial, investment, trading, or other types of advice or recommendations supplied or endorsed by TradingView. Read more in the Terms of Use.