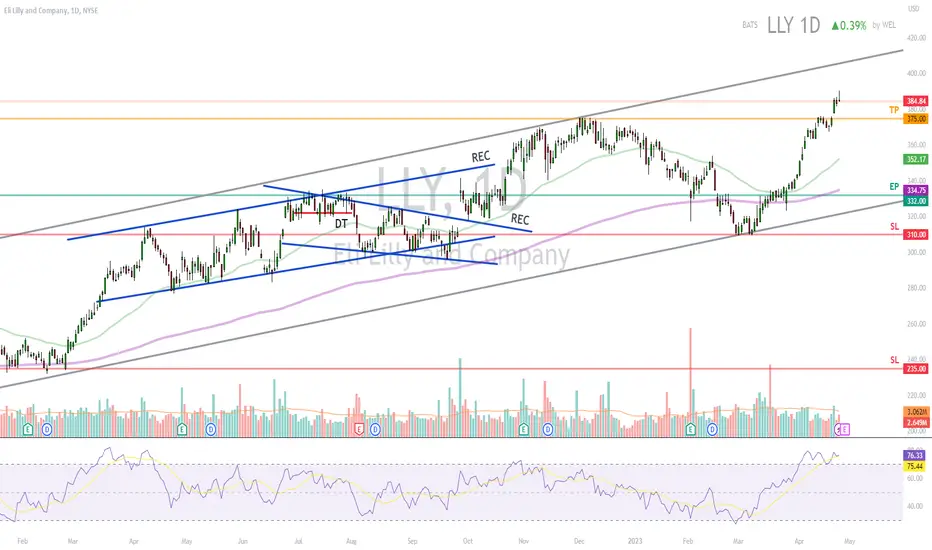
- LLY is in a rising trend channel in the medium long term.
- LLY has also received a positive signal from the moving average indicator, thus signaling a continued rise.
- LLY has broken up through resistance at 375.
- The short term momentum of the stock is strongly positive, with RSI above 70.
- Overall assessed as technically positive for the medium long term.
*EP: Enter Price, SL: Support, TP: Take Profit, CL: Cut Loss, TF: Time Frame, RST: Resistance, RTS: Resistance to be Support LT TP: Long Term Target Price
*Chart Pattern:
DT - Double Top | BEARISH | RED
DB - Double Bottom | BULLISH | GREEN
HNS - Head & Shoulder | BEARISH | RED
REC - Rectangle | BLUE
iHNS - inverse head & Shoulder | BULLISH | GREEN
Verify it first and believe later.
WavePoint ❤️
The most profitable U.S. Stock VIP Signals Provider in Telegram Channel | Check our latest product updates: bit.ly/wavepoint-vip |
For more info:
Telegram: t.me/Wel_99
X: x.com/wavepoint99
For more info:
Telegram: t.me/Wel_99
X: x.com/wavepoint99
Disclaimer
The information and publications are not meant to be, and do not constitute, financial, investment, trading, or other types of advice or recommendations supplied or endorsed by TradingView. Read more in the Terms of Use.