OVERVIEW:
LLY has recently undergone a significant correction from its highs, finding strong demand at a crucial support zone. Price action now presents two distinct, high-probability long entry scenarios based on the stock's interaction with key horizontal levels. My analysis outlines potential entry points, clear targets, and risk management.
KEY OBSERVATIONS & MARKET STRUCTURE:
Major Demand Zone Established:
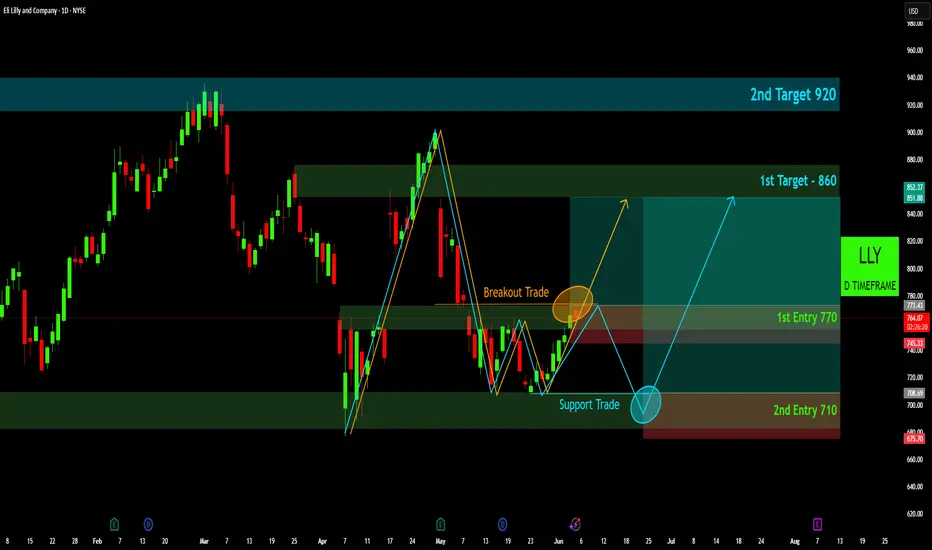
Following a notable pullback in early May, LLY found substantial buying interest within the lower green horizontal zone (approximately $680 - $710). This area has acted as a robust "Support Trade" zone, preventing further downside and initiating a corrective bounce.
Corrective Rally & Intermediate Resistance:
From this strong support, LLY mounted a decent rally, completing a clear W-formation or basing pattern (highlighted by the orange and blue zig-zag lines).
Price is currently interacting with an intermediate resistance level / supply zone (the upper grey/light green horizontal zone around $755 - $775). This level represents a critical point of contention between buyers and sellers.
Two Strategic Entry Scenarios:
The current market context offers two distinct long entry approaches, each with its own risk/reward profile:
Scenario 1: Breakout Trade (Orange Ellipse / "1st Entry Above 775")
A. Condition: This strategy focuses on a decisive breakout and sustained close above the current intermediate resistance level (approx. $775). A strong daily candle closing above this zone would confirm bullish momentum.
B. Entry: Look for price action to confirm the breakout, potentially on a retest of the broken resistance now acting as support (as indicated by the orange arrow and ellipse). An entry above $775 is targeted here.
C. Risk Management: A stop-loss should be placed just below the breakout level and the recent swing low, ideally around $745.33 (bottom of the red box).
Scenario 2: Support Trade (Blue Ellipse / "2nd Entry 710")
A. Condition: This strategy anticipates a potential rejection from the current intermediate resistance, leading to a pullback to the primary demand zone (approx. $710).
B. Entry: Look for strong bullish reversal signals (e.g., bullish engulfing candle, hammer, demand zone rejection) if price retraces to the lower demand zone around $710 (indicated by the blue arrow and ellipse). This offers a potentially lower risk entry with a better risk-to-reward ratio for the same targets.
C. Risk Management: A stop-loss would be positioned just below the main support zone, around $675.70 (bottom of the larger red box).
POTENTIAL TARGETS:
Regardless of the entry scenario, our upside targets remain consistent based on prior price structure and supply zones:
• 1st Target: $860 (Green Zone): This is a significant resistance level from earlier price action, representing the first major hurdle for buyers.
• 2nd Target: $920 (Upper Green Zone): This represents the ultimate upside target, aligning with the previous all-time highs and a major supply zone.
INVALIDATION:
• For "Breakout Trade" (1st Entry): A sustained daily close below $745.33 would invalidate this specific trade idea.
• For "Support Trade" (2nd Entry): A sustained daily close below $675.70 would invalidate the entire bullish bias derived from the primary demand zone and suggest further downside is likely.
CONCLUSION:
LLY is presenting clear technical setups after finding substantial support. Traders can opt for an aggressive Breakout Trade if momentum sustains through intermediate resistance, or a more conservative Support Trade if price retraces to the established demand zone. Both strategies aim for significant upside potential towards $860 and $920, with clearly defined risk management levels.
Risk Management is Paramount: Always adhere to your stop-loss and position sizing to protect your capital. This is not financial advice; do your own research.
Disclaimer:
The information provided in this chart is for educational and informational purposes only and should not be considered as investment advice. Trading and investing involve substantial risk and are not suitable for every investor. You should carefully consider your financial situation and consult with a financial advisor before making any investment decisions. The creator of this chart does not guarantee any specific outcome or profit and is not responsible for any losses incurred as a result of using this information. Past performance is not indicative of future results. Use this information at your own risk. This chart has been created for my own improvement in Trading and Investment Analysis. Please do your own analysis before any investments.
LLY has recently undergone a significant correction from its highs, finding strong demand at a crucial support zone. Price action now presents two distinct, high-probability long entry scenarios based on the stock's interaction with key horizontal levels. My analysis outlines potential entry points, clear targets, and risk management.
KEY OBSERVATIONS & MARKET STRUCTURE:
Major Demand Zone Established:
Following a notable pullback in early May, LLY found substantial buying interest within the lower green horizontal zone (approximately $680 - $710). This area has acted as a robust "Support Trade" zone, preventing further downside and initiating a corrective bounce.
Corrective Rally & Intermediate Resistance:
From this strong support, LLY mounted a decent rally, completing a clear W-formation or basing pattern (highlighted by the orange and blue zig-zag lines).
Price is currently interacting with an intermediate resistance level / supply zone (the upper grey/light green horizontal zone around $755 - $775). This level represents a critical point of contention between buyers and sellers.
Two Strategic Entry Scenarios:
The current market context offers two distinct long entry approaches, each with its own risk/reward profile:
Scenario 1: Breakout Trade (Orange Ellipse / "1st Entry Above 775")
A. Condition: This strategy focuses on a decisive breakout and sustained close above the current intermediate resistance level (approx. $775). A strong daily candle closing above this zone would confirm bullish momentum.
B. Entry: Look for price action to confirm the breakout, potentially on a retest of the broken resistance now acting as support (as indicated by the orange arrow and ellipse). An entry above $775 is targeted here.
C. Risk Management: A stop-loss should be placed just below the breakout level and the recent swing low, ideally around $745.33 (bottom of the red box).
Scenario 2: Support Trade (Blue Ellipse / "2nd Entry 710")
A. Condition: This strategy anticipates a potential rejection from the current intermediate resistance, leading to a pullback to the primary demand zone (approx. $710).
B. Entry: Look for strong bullish reversal signals (e.g., bullish engulfing candle, hammer, demand zone rejection) if price retraces to the lower demand zone around $710 (indicated by the blue arrow and ellipse). This offers a potentially lower risk entry with a better risk-to-reward ratio for the same targets.
C. Risk Management: A stop-loss would be positioned just below the main support zone, around $675.70 (bottom of the larger red box).
POTENTIAL TARGETS:
Regardless of the entry scenario, our upside targets remain consistent based on prior price structure and supply zones:
• 1st Target: $860 (Green Zone): This is a significant resistance level from earlier price action, representing the first major hurdle for buyers.
• 2nd Target: $920 (Upper Green Zone): This represents the ultimate upside target, aligning with the previous all-time highs and a major supply zone.
INVALIDATION:
• For "Breakout Trade" (1st Entry): A sustained daily close below $745.33 would invalidate this specific trade idea.
• For "Support Trade" (2nd Entry): A sustained daily close below $675.70 would invalidate the entire bullish bias derived from the primary demand zone and suggest further downside is likely.
CONCLUSION:
LLY is presenting clear technical setups after finding substantial support. Traders can opt for an aggressive Breakout Trade if momentum sustains through intermediate resistance, or a more conservative Support Trade if price retraces to the established demand zone. Both strategies aim for significant upside potential towards $860 and $920, with clearly defined risk management levels.
Risk Management is Paramount: Always adhere to your stop-loss and position sizing to protect your capital. This is not financial advice; do your own research.
Disclaimer:
The information provided in this chart is for educational and informational purposes only and should not be considered as investment advice. Trading and investing involve substantial risk and are not suitable for every investor. You should carefully consider your financial situation and consult with a financial advisor before making any investment decisions. The creator of this chart does not guarantee any specific outcome or profit and is not responsible for any losses incurred as a result of using this information. Past performance is not indicative of future results. Use this information at your own risk. This chart has been created for my own improvement in Trading and Investment Analysis. Please do your own analysis before any investments.
Disclaimer
The information and publications are not meant to be, and do not constitute, financial, investment, trading, or other types of advice or recommendations supplied or endorsed by TradingView. Read more in the Terms of Use.
Disclaimer
The information and publications are not meant to be, and do not constitute, financial, investment, trading, or other types of advice or recommendations supplied or endorsed by TradingView. Read more in the Terms of Use.