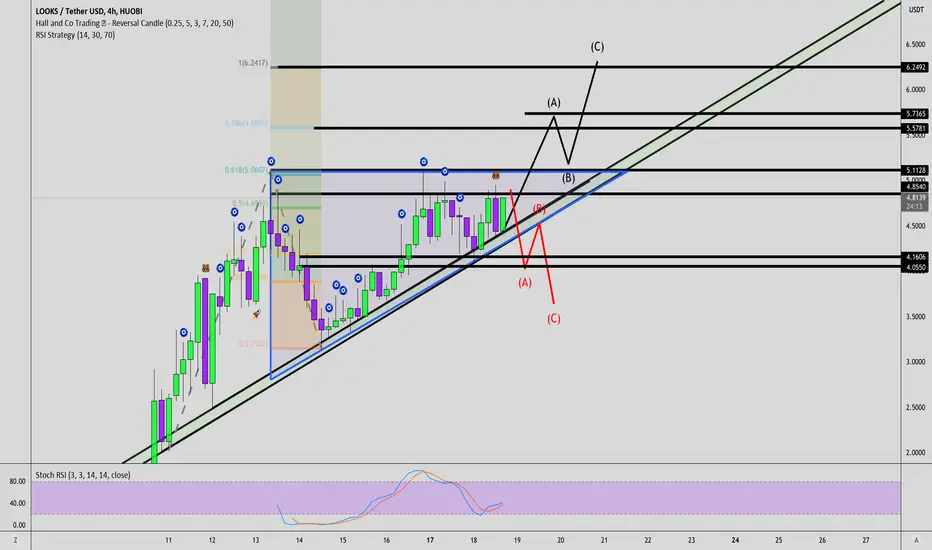
LOOKS/USDT ASCENDING TRIANGLE BREAKOUT
Support: $5.45/$5.05/$4.75/$4.25/ $4.00/ $3.75/ $3.50/ $3.00
Resistance: $5.75/$6.00/ $6.25/ $6.55/$7.00
An ascending triangle is a chart pattern used in technical analysis .
It is created by price moves that allow for a horizontal line to be drawn along the swing highs,
and a rising trendline to be drawn along the swing lows.
The two lines form a triangle. Traders often watch for breakouts from triangle patterns
Related publications
Disclaimer
The information and publications are not meant to be, and do not constitute, financial, investment, trading, or other types of advice or recommendations supplied or endorsed by TradingView. Read more in the Terms of Use.
Related publications
Disclaimer
The information and publications are not meant to be, and do not constitute, financial, investment, trading, or other types of advice or recommendations supplied or endorsed by TradingView. Read more in the Terms of Use.