Long
LOOMBTC Impulsive breakthrough
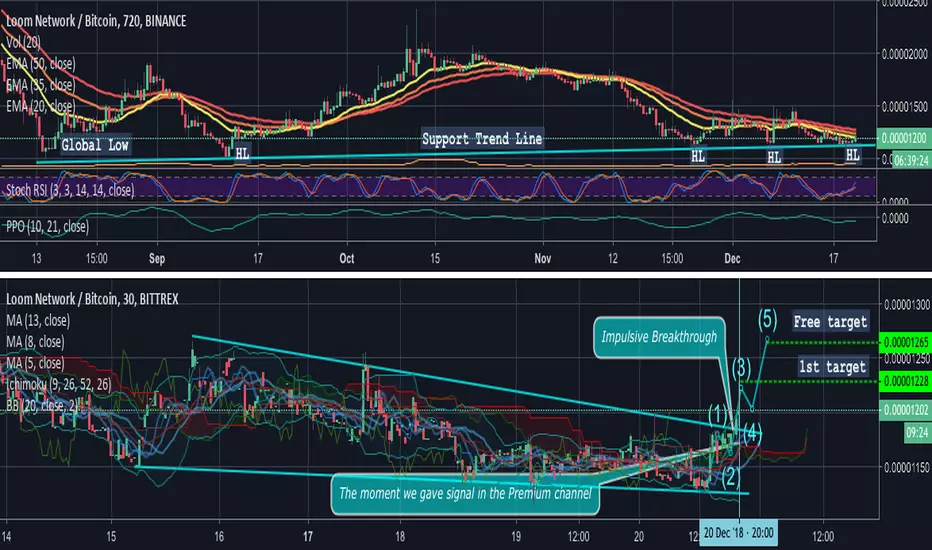
There are two charts in the analysis. Upper graph represents long term support trend line. We can see that the price crawled to it again and accurately touched. It bounced from it 4 times before and did it again.
At the lower chart the current situation is described. Indicators are neutral-bullish, while the price made an impulsive breakthrough.
We made this signal and published it in the premium just a 5-10 minutes before the price reached 1st target from the mentioned buy zone. It is a pretty accurate and quick hit. Enjoy free target and always follow the risk aversion strategy. Stay tuned
Sincerely,
SkyRock Signals team
Access private PineScript strategies and turn alerts into orders with easy-to-set up bots
Trade smarter with:
skyrexio.com
Trade smarter with:
skyrexio.com
Related publications
Disclaimer
The information and publications are not meant to be, and do not constitute, financial, investment, trading, or other types of advice or recommendations supplied or endorsed by TradingView. Read more in the Terms of Use.