Fibonacci level test on my previous trend analysis of LOOM
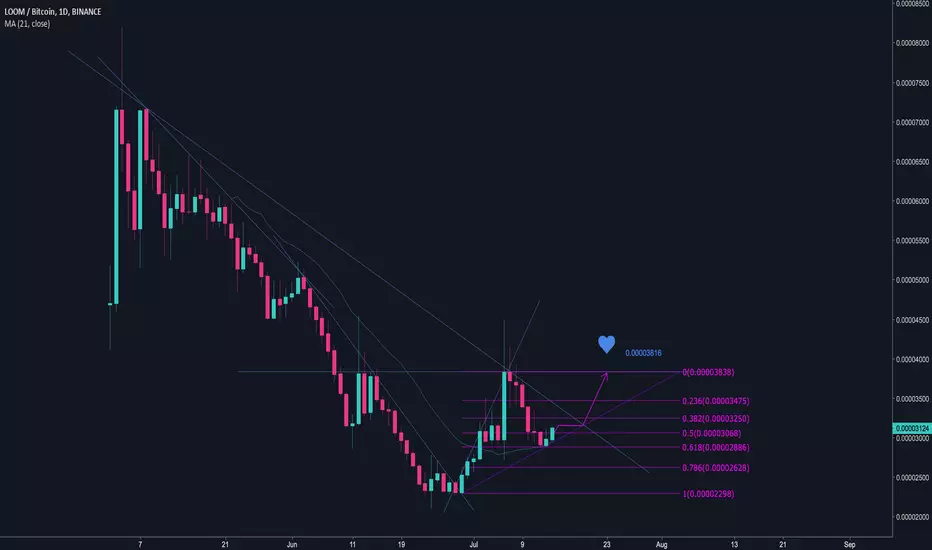
I took the fib levels tool and tested the recent support of 0.00002885 on the daily chart of LOOM – and believe it or not, it turned out to be a '618' key level of the recent retracement. It held this support level pretty well, which is another strong indicator for a short term reversal. In other words, it is very likely that we will see a strong bounce back over the next days. Keep an eye on this one!
Disclaimer
The information and publications are not meant to be, and do not constitute, financial, investment, trading, or other types of advice or recommendations supplied or endorsed by TradingView. Read more in the Terms of Use.
Disclaimer
The information and publications are not meant to be, and do not constitute, financial, investment, trading, or other types of advice or recommendations supplied or endorsed by TradingView. Read more in the Terms of Use.