Long
$LOOM hovering on a support trendline in confluence with 200ema
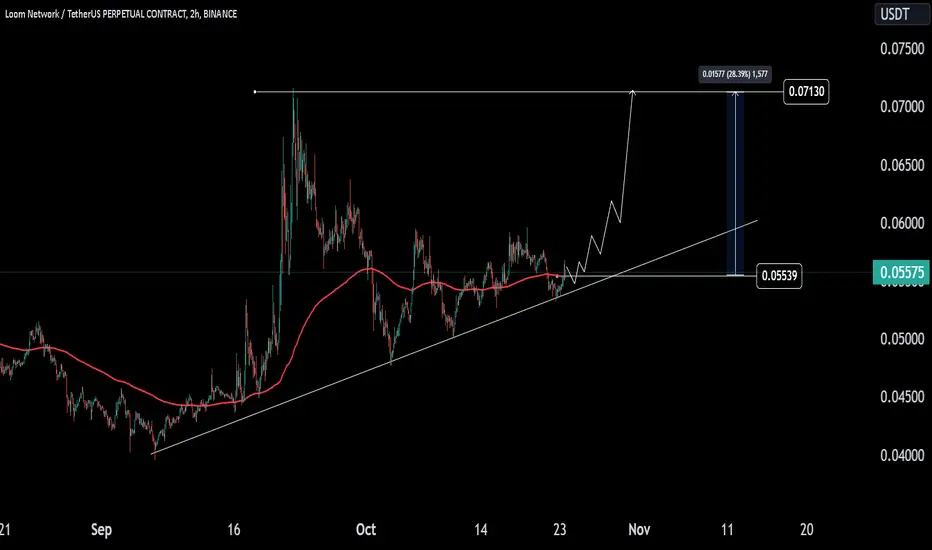
Ascending Support Line: The price is respecting a clear ascending trendline, acting as support. Every time the price touches this line, it bounces back, suggesting that buyers are still in control.
Moving Average: The 200-period moving average (red line) is providing additional support, and the price is currently above it, which typically signals a bullish bias.
Potential Breakout: The projected price action shows a bullish scenario with a potential 28% upside from the current level. The target indicated on the chart is around $0.07130, with a current price of $0.05574.
Resistance Levels: The upper horizontal resistance is marked near $0.07130. Breaking this level could open the door for a larger upward movement, but this would depend on the strength of the volume and market conditions.
Price Target: If the ascending support continues to hold, the price may rise gradually before breaking out toward the $0.07130 resistance, representing a potential 28% gain from the current level.
Disclaimer
The information and publications are not meant to be, and do not constitute, financial, investment, trading, or other types of advice or recommendations supplied or endorsed by TradingView. Read more in the Terms of Use.
Disclaimer
The information and publications are not meant to be, and do not constitute, financial, investment, trading, or other types of advice or recommendations supplied or endorsed by TradingView. Read more in the Terms of Use.