Technical Analysis
Weekly Timeframe - Key Bullish Indicators
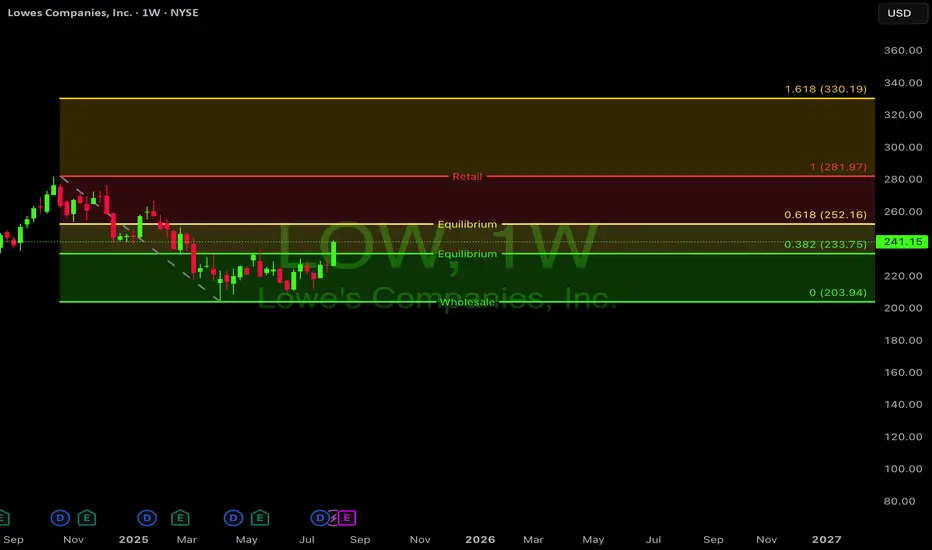
LOW has formed a strong base around the $206-$225 range and appears to be in an early stage of an uptrend
Recent weekly candle shows a decisive bullish move, closing at $241.15 which is the highest weekly close since March 2025
The stock is trading above two key support levels identified on your chart:
Strong support at $206.38 which has held multiple times since 2023
Current price at $241.15 is showing momentum above the midterm resistance-turned-support at $240
Fundamental Catalysts
Positive Earnings Surprises: Q1 2025 earnings beat estimates with EPS of $2.92 vs $2.88 expected (+1.39%)
Strong Analyst Support: Despite market turbulence:
17 out of 29 recent analyst ratings are "buy" ratings
Multiple price targets between $260-$300, suggesting 8-24% upside potential
Recent upgrade from Keybanc to "buy" with a $266 target (April 25, 2025)
Valuation Metrics:
Current P/E ratio of 18.2 (Q1 2025) is reasonable compared to historical average
Operating margin improved to 11.9% in Q1 2025, showing operational efficiency
Key Levels to Watch
Support:
Primary support at $206.38 (clearly marked on your chart)
Secondary support at $225-$230 range (recent consolidation zone)
Resistance:
Major resistance at $287.01 (marked on your chart)
Intermediate resistance at $250-$255 (based on recent price action)
Bullish Scenario
The technical setup suggests LOW has completed a multi-month consolidation period and is now beginning a new bullish phase. With strong fundamental support from analysts and improving margins, the stock appears positioned for a potential move toward the $260-$280 range in the coming weeks.
The recent price action breaking above the $240 level with increased momentum suggests buyers are regaining control, which aligns with the positive analyst sentiment.
Weekly Timeframe - Key Bullish Indicators
LOW has formed a strong base around the $206-$225 range and appears to be in an early stage of an uptrend
Recent weekly candle shows a decisive bullish move, closing at $241.15 which is the highest weekly close since March 2025
The stock is trading above two key support levels identified on your chart:
Strong support at $206.38 which has held multiple times since 2023
Current price at $241.15 is showing momentum above the midterm resistance-turned-support at $240
Fundamental Catalysts
Positive Earnings Surprises: Q1 2025 earnings beat estimates with EPS of $2.92 vs $2.88 expected (+1.39%)
Strong Analyst Support: Despite market turbulence:
17 out of 29 recent analyst ratings are "buy" ratings
Multiple price targets between $260-$300, suggesting 8-24% upside potential
Recent upgrade from Keybanc to "buy" with a $266 target (April 25, 2025)
Valuation Metrics:
Current P/E ratio of 18.2 (Q1 2025) is reasonable compared to historical average
Operating margin improved to 11.9% in Q1 2025, showing operational efficiency
Key Levels to Watch
Support:
Primary support at $206.38 (clearly marked on your chart)
Secondary support at $225-$230 range (recent consolidation zone)
Resistance:
Major resistance at $287.01 (marked on your chart)
Intermediate resistance at $250-$255 (based on recent price action)
Bullish Scenario
The technical setup suggests LOW has completed a multi-month consolidation period and is now beginning a new bullish phase. With strong fundamental support from analysts and improving margins, the stock appears positioned for a potential move toward the $260-$280 range in the coming weeks.
The recent price action breaking above the $240 level with increased momentum suggests buyers are regaining control, which aligns with the positive analyst sentiment.
Disclaimer
The information and publications are not meant to be, and do not constitute, financial, investment, trading, or other types of advice or recommendations supplied or endorsed by TradingView. Read more in the Terms of Use.
Disclaimer
The information and publications are not meant to be, and do not constitute, financial, investment, trading, or other types of advice or recommendations supplied or endorsed by TradingView. Read more in the Terms of Use.