Long
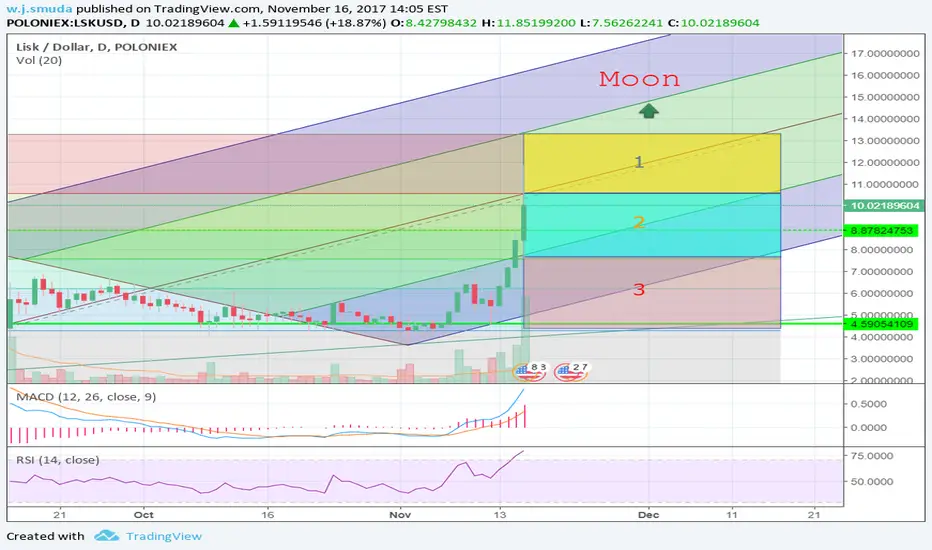
Lisk Buy Zones and possible setbacks
Hey!
Those 3 zones describe 3 different possible price movements. Lisk is long term bullish and looks very promising. This chart should help investors to find a better moment to get in the game or enlarge their position. The numbers represent the necessity to buy. 1 lowest (Hold) - 3 highest (Strong Buy).
Please be nice to me :O
Disclaimer
The information and publications are not meant to be, and do not constitute, financial, investment, trading, or other types of advice or recommendations supplied or endorsed by TradingView. Read more in the Terms of Use.
Disclaimer
The information and publications are not meant to be, and do not constitute, financial, investment, trading, or other types of advice or recommendations supplied or endorsed by TradingView. Read more in the Terms of Use.