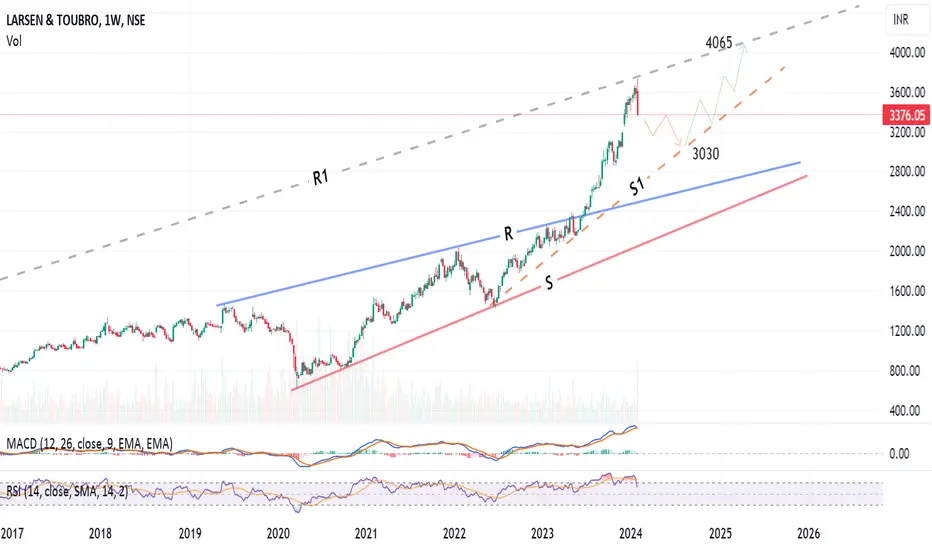
Weekly chart, the stock formed a rising wedge and reached the target.
The technical indicator RSI reached an over-bought zone..
This is my imaginary path for the next 14 months: down zigzag to S1 at around 3030, then up zigzag to R1 at around 4065
Above 3750 for 2 weeks, will void this path, and the stock will target 5750 long-term.
The technical indicator RSI reached an over-bought zone..
This is my imaginary path for the next 14 months: down zigzag to S1 at around 3030, then up zigzag to R1 at around 4065
Above 3750 for 2 weeks, will void this path, and the stock will target 5750 long-term.
Disclaimer
The information and publications are not meant to be, and do not constitute, financial, investment, trading, or other types of advice or recommendations supplied or endorsed by TradingView. Read more in the Terms of Use.
Disclaimer
The information and publications are not meant to be, and do not constitute, financial, investment, trading, or other types of advice or recommendations supplied or endorsed by TradingView. Read more in the Terms of Use.