ANALYSIS 🔎
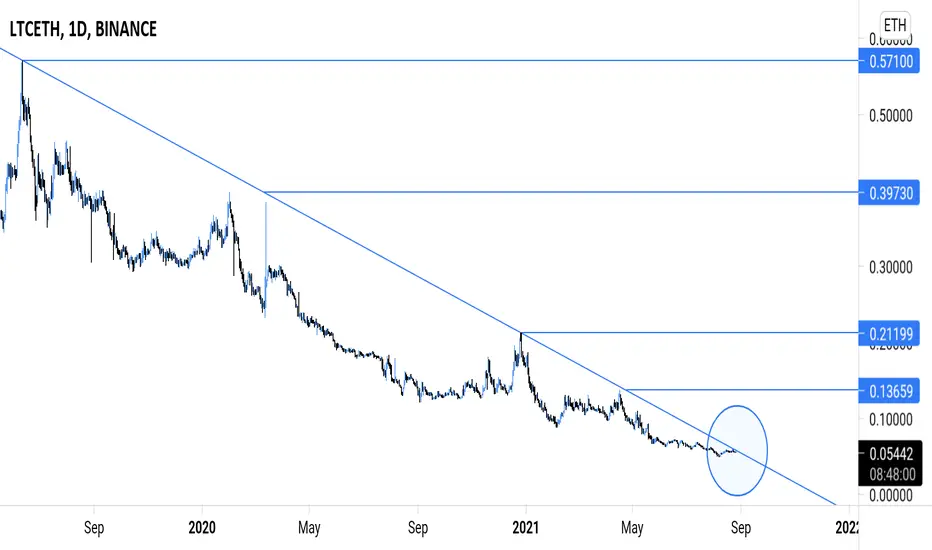
- LTC/ETH has been resisted by the long term descending trendline resistance since 12th June 2019.
- Price is testing the descending trendline resistance (circled zone).
- After three breakout attempts, we could be on the verge of a successful breakout above the descending trendline resistance.
- Key horizontal resistance levels have been indicated on the chart.
- If a successful breakout is achieved, the horizontal resistance levels can be used as your take profit targets.
- Draw your line and watch.
Eğlence 🥂
Disclaimer
The information and publications are not meant to be, and do not constitute, financial, investment, trading, or other types of advice or recommendations supplied or endorsed by TradingView. Read more in the Terms of Use.
Disclaimer
The information and publications are not meant to be, and do not constitute, financial, investment, trading, or other types of advice or recommendations supplied or endorsed by TradingView. Read more in the Terms of Use.