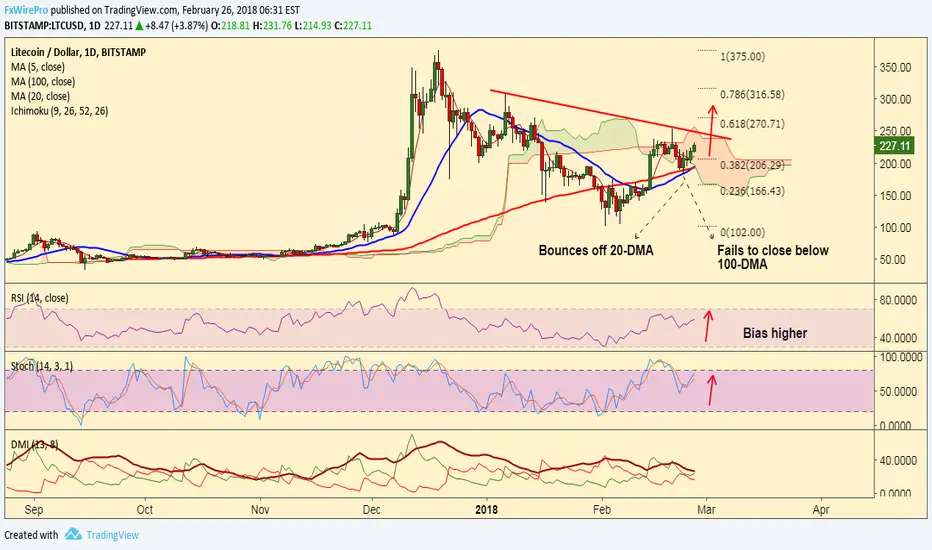
LTC/USD has bounced off 20-DMA support in last week's trade.
The pair has broken above 5-DMA which is currently immediate support at 210 levels.
The pair has failed to close below 100-DMA, bias higher.
Technical indicators support upside in the pair. RSI and Stochs are biased higher and we see +ve DMI dominance.
Upside finds stiff resistance at major trendline at 250 levels. Violation there could see further upsdie.
On the downside, we see strong support at 193 levels. Bullish invalidation only on decisive break below.
Support levels - 210 (5-DMA), 194 (20-DMA), 193 (100-DMA), 182 (Feb 23 low)
Resistance levels - 250 (Trendline), 252 (Feb 20 high), 270 (61.8% Fib retrace of 375 to 102 fall)
Good to go long around 220, SL: 190, TP: 250/ 270/ 300
Disclaimer
The information and publications are not meant to be, and do not constitute, financial, investment, trading, or other types of advice or recommendations supplied or endorsed by TradingView. Read more in the Terms of Use.
Disclaimer
The information and publications are not meant to be, and do not constitute, financial, investment, trading, or other types of advice or recommendations supplied or endorsed by TradingView. Read more in the Terms of Use.