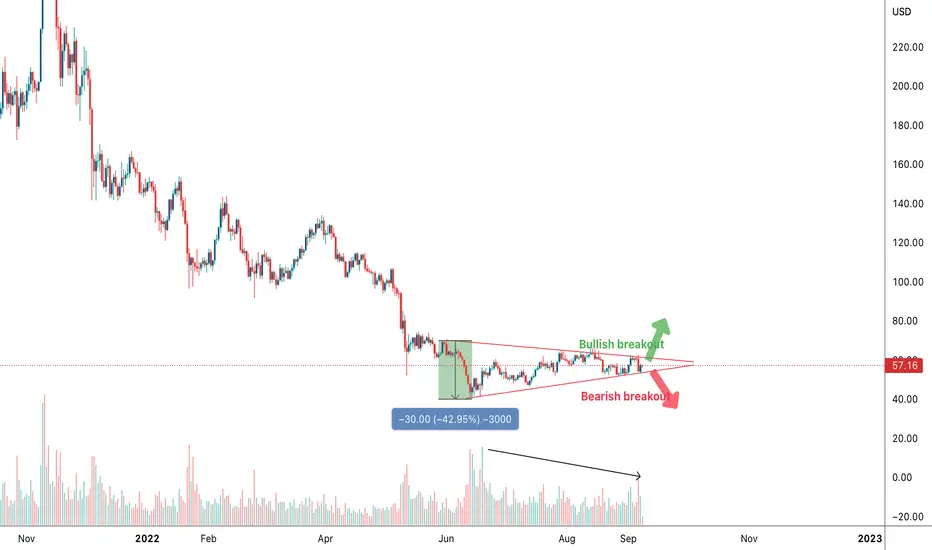
• Symmetrical triangle on daily chart
• Breakout could be in either direction
• Target distance from breakout point is distance between highest and lowest point in the triangle
• 30 in this case (69.86-39.86)
• Triangle is shrinking so we are close to breakout
• Scenario 1: bearish breakout around 50 +/-, target is 20 +/-
• Scenario 2: bullish breakout around 60 +/-, target is 90 +/-
Note: Ideally, volume tends to decrease as the triangle shrinks and get close to breakout. So I added a volume indicator below the chart to highlight this idea.
Advice: It is recommended not to rush and place orders before getting clear confirmation of a successful breakout. Keep in mind that breakouts can sometimes be fake.
Disclaimer
The information and publications are not meant to be, and do not constitute, financial, investment, trading, or other types of advice or recommendations supplied or endorsed by TradingView. Read more in the Terms of Use.
Disclaimer
The information and publications are not meant to be, and do not constitute, financial, investment, trading, or other types of advice or recommendations supplied or endorsed by TradingView. Read more in the Terms of Use.