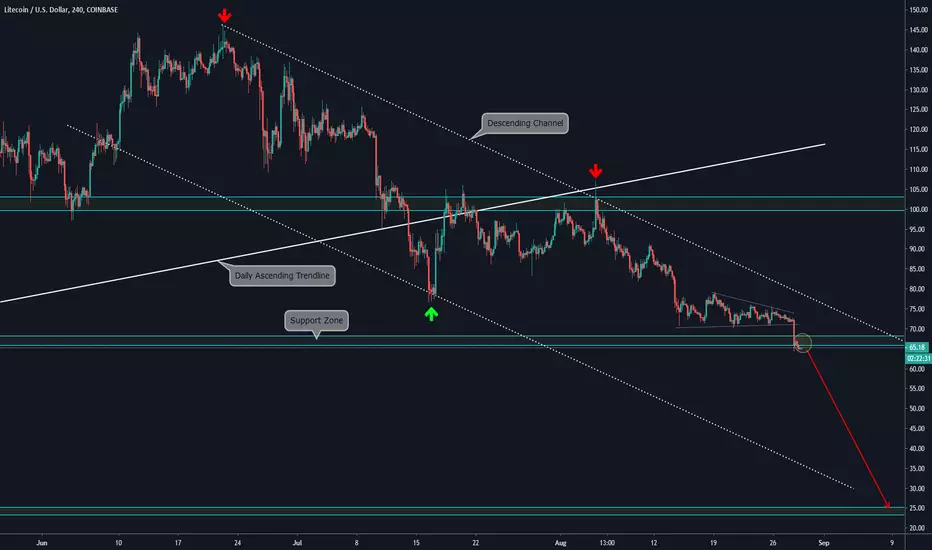
4H CHART EXPLANATION:
On this timeframe, we observe that price resolved perfectly the last triangle formation. At this moment it is facing the Support Zone, but it has not consolidated clearly below yet. In case it happens, then it would be a strong bearish signal. Technicaly the next Support level is the bottom of the Descending Channel or the Support Zone at 25.
DAILY CHART EXPLANATION:
Related publications
Disclaimer
The information and publications are not meant to be, and do not constitute, financial, investment, trading, or other types of advice or recommendations supplied or endorsed by TradingView. Read more in the Terms of Use.
Related publications
Disclaimer
The information and publications are not meant to be, and do not constitute, financial, investment, trading, or other types of advice or recommendations supplied or endorsed by TradingView. Read more in the Terms of Use.