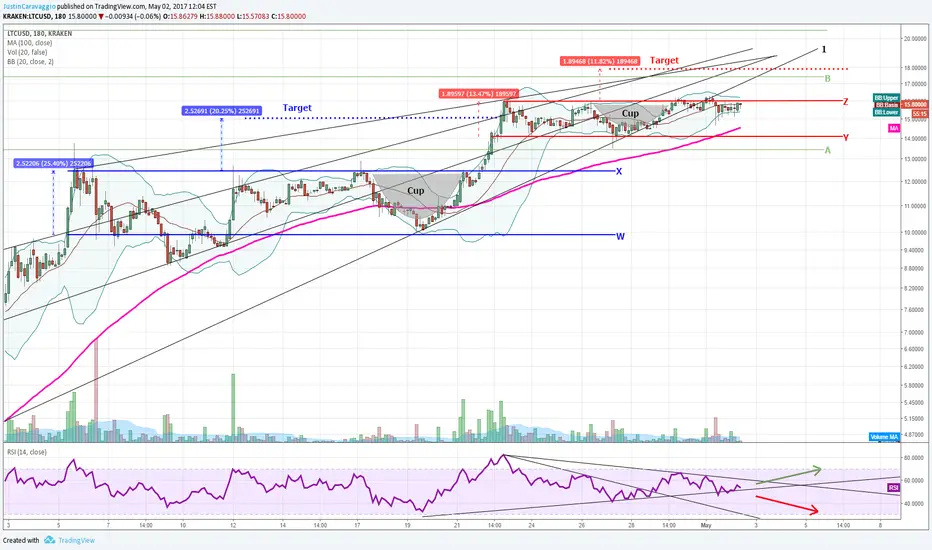
The blue triangle (lines W and X) forecasted a $2.50 cent move upward. Bottom of the current red rectangle (lines Y and Z) touched long term support line A (green). As the bollinger band squeezes, the rectangle forecasts a move of $1.90.
We could find resistance at long term support line B (green) as well as diagonal trend line 1 (black)
If weakness ensures and the RSI breaks down below its trendline, we could see the 100 day MA (pink line), red line Y and green line A as strong support.
If we break through resistance, we could see $18 hit (kraken)
Disclaimer
The information and publications are not meant to be, and do not constitute, financial, investment, trading, or other types of advice or recommendations supplied or endorsed by TradingView. Read more in the Terms of Use.
Disclaimer
The information and publications are not meant to be, and do not constitute, financial, investment, trading, or other types of advice or recommendations supplied or endorsed by TradingView. Read more in the Terms of Use.