I have been watching this chart for a while, trying to figure out a potential count. Lots of fibs point around 85$ area but the current structure seems incomplete. Instead of waiting to see it complete and then post, i decided to yolo it.
What could go wrong?!
What could go wrong?!
Note
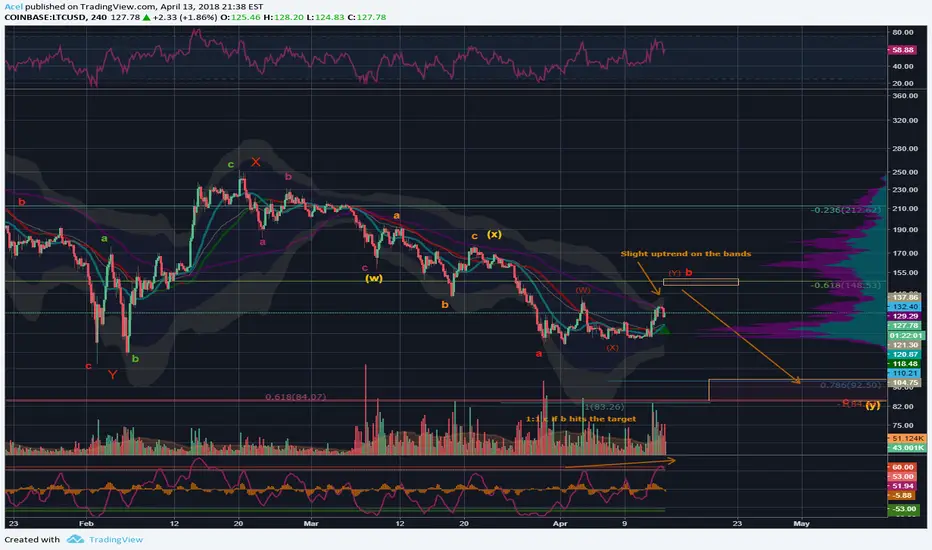
I dont have any count on the pair ( maybe i will start one if the market keeps being boring ), but there are some DIVSs on the oscillators and a gap on VPVR that favor an uptrend.Trade closed: target reached
Target on the way up. Potential top around 154.Note
Still bellow the invalidation point, if you think its bullish, be my guest.Note
Still valid, no close above the line, also it lost the up trend support line. They forgot to turn on the LTC bots, it happens.Note
I checked the ratios again and it likes to stop just before the 2:1 ratio, so there is a chance it can stop just below 170 if it has one more leg up. Still looking bearish, invalidation level above 175.5 .Note
Scenario is invalidated here.ETH and BTC have a positive correlation lately so maybe the inverse corelation with LTC is back ( one moves faster and then the other one catches up).
Note
Welp, fibs dont lie! I havent checked that chart ever since, but just by staring at it now it MAY have another push down if it gets denied at ~110.Related publications
Disclaimer
The information and publications are not meant to be, and do not constitute, financial, investment, trading, or other types of advice or recommendations supplied or endorsed by TradingView. Read more in the Terms of Use.
Related publications
Disclaimer
The information and publications are not meant to be, and do not constitute, financial, investment, trading, or other types of advice or recommendations supplied or endorsed by TradingView. Read more in the Terms of Use.