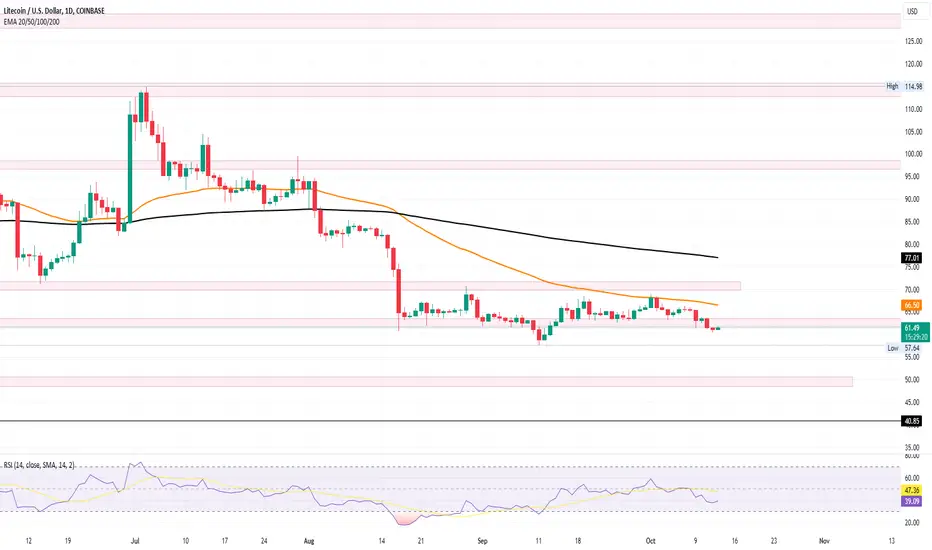
Falling Trend: LTC is under the influence of the 50-day EMA.
Death Cross: A death cross in the daily chart indicates bearish momentum.
Psychological Mark: A drop below $60 could lead LTC to $50.
Bearish Pressure: LTC has experienced a 44% downfall before entering a sideways track.
Crucial Zones: LTC is trapped between $60 and $72.
Inverted H&S Nullified: Rejection from the 50-day EMA nullifies the inverted head and shoulder pattern.
10% Drop: LTC has fallen 10% in the last 10 days.
Today's Price: LTC is trading at $61.33 with a 0.38% intraday growth.
Morning Star: A potential morning star pattern could signal a bullish reversal.
RSI Status: The daily RSI is nearing the oversold boundary.
Dynamic Resistance: The 50-day EMA acts as a barrier to bullish growth.
Bullish Viewpoint: Despite the bearish trend, there's a bullish outlook for the coming months.
Disclaimer
The information and publications are not meant to be, and do not constitute, financial, investment, trading, or other types of advice or recommendations supplied or endorsed by TradingView. Read more in the Terms of Use.
Disclaimer
The information and publications are not meant to be, and do not constitute, financial, investment, trading, or other types of advice or recommendations supplied or endorsed by TradingView. Read more in the Terms of Use.