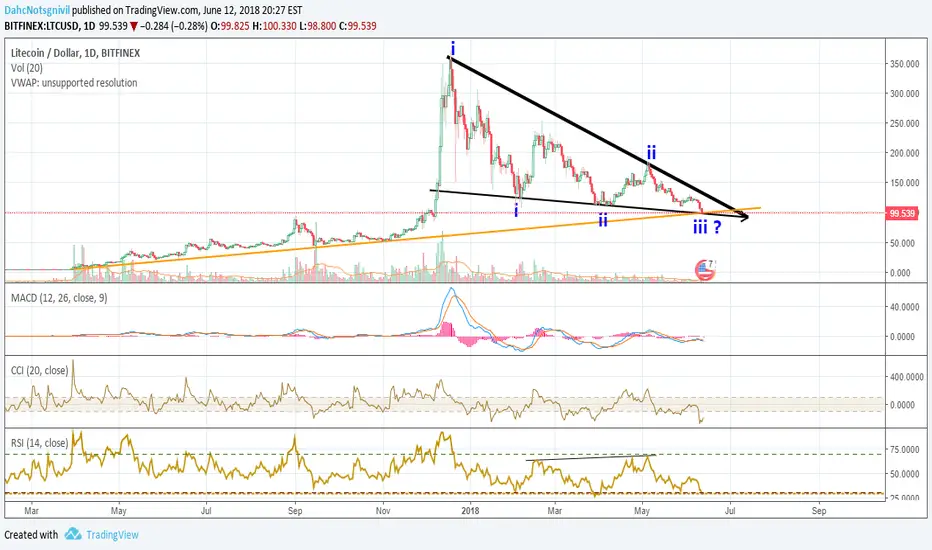
Since the initial price break, LTC has just checked into the original bullish support as we got dragged down by the King, BTC. It is a very interesting place we have stopped as this happens to be the crossroads of the bottom support of the pennant and longest bullish support line. As long as it holds, it should send us up and out of the triangle. A lot of longs have been liquidated at this point - look for price chasing if we go up, especially if we spike quickly. This is LTC's last shot.
There is also a bullish divergence in the RSI and LTC/BTC is in a giant pennant looking to breakout as well - meaning breaking free from BTC prices for a little while and not being rag-dolled down. July 17th seems to be an important date based off LTC/BTC - then end of the pennant. The start of the moonshot, or the expiration date for litecoin? - very interested in finding out.
If you're wondering about the roman numerals, search "three drives pattern" - please thumbs up if you want this updated regularly with targets and what not.
This is not financial advice or trading advice. Just interpreting the charts as they change. Do your own research -- you have the internet at your fingertips don't put your whole fate in someone else's hands.
Note
Currently on my way to work so am unable to make a chart but that drop this morning was unexpected but o.k. as long as the wick is sucked up by days end. You can see at previous support lines there are wicks that extend past the support line from panic selling and blood in the streets buyers. Today will be very interesting, look for a reversal or this chart needs to be adjustedNote
We just bounced off a support from the wicks in February, lets see if it holds before entering a trade!
Note
Still have held the support from the February double bottom wicks. If i zoom out, the wave trend looks identical to a reversal. Nice looking doji and morning start setup, hopefully the volume pours in. We have under 3 hours before the 1D UTC candle closes outside of the falling wedge and nullifies the pattern on a 1D aggregate chart.
Please like if you want this post to stay updated.
Note
Looking even better on the 2H chart. Morning Star with Long entry confirmation on wave trend (not always right)
Note
Look at this! LTC/BTC 6 hr looking like a strong reversal which coincides with what we'd need to see out of the morning star before days end! Thumbs up - LTC may be alive after all!
Note
Here we go! Also found a head and shoulders on the 30 minute to confirm all this! We have confluence! Thumbs up as we should see the thrusters kick on!
Note
We did it - although it did take a few hours longer than hoped. This is shaping up nicely as a 3 drives pattern! Only thing left to do is breakout of the top!
Note
LTC/BTC looking very bullish and about to take a run at the resistance. Breakout will set LTC free from BTC for a while!
Note
Shaping up much like Aprils bottom. Accumulation should almost be over as we head toward the top in the coming days. Breakthrough would bring us back to ATH's
Disclaimer
The information and publications are not meant to be, and do not constitute, financial, investment, trading, or other types of advice or recommendations supplied or endorsed by TradingView. Read more in the Terms of Use.
Disclaimer
The information and publications are not meant to be, and do not constitute, financial, investment, trading, or other types of advice or recommendations supplied or endorsed by TradingView. Read more in the Terms of Use.