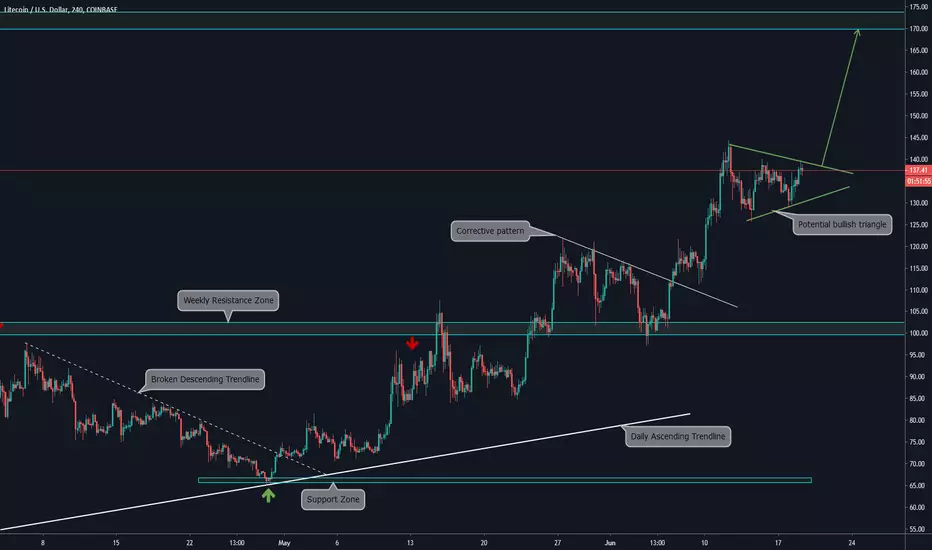
4H CHART EXPLANATION:
Price has broke the Weekly Resistance Zone, consolidating on a corrective structure to continue the Bullish Movement. Right now it is on a Triangle Pattern, that may resolve upwards. If that happen, then the target for the bullish move is the Resistance Zone explained on the Daily Chart.
You can check our full top and bottom analysis on Related Ideas.
Daily Chart:
Related publications
Disclaimer
The information and publications are not meant to be, and do not constitute, financial, investment, trading, or other types of advice or recommendations supplied or endorsed by TradingView. Read more in the Terms of Use.
Related publications
Disclaimer
The information and publications are not meant to be, and do not constitute, financial, investment, trading, or other types of advice or recommendations supplied or endorsed by TradingView. Read more in the Terms of Use.