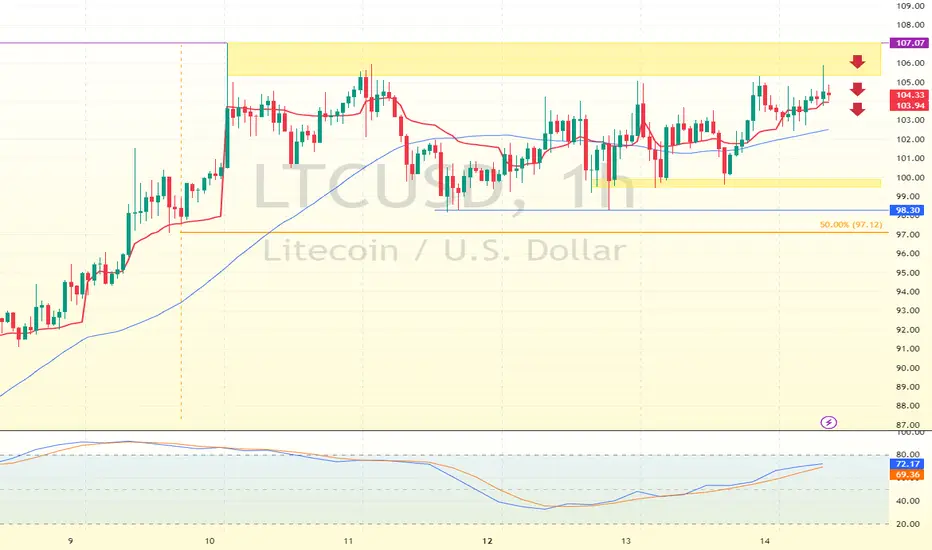
FenzoFx—Litecoin is testing the supply zone, highlighted in the 1-hour chart. The primary trend is bullish, as the price is above the 50-period simple moving average.
However, the price action techniques show that sellers exist in the resistance area, which expands from \$105.0 to \$107.0. Therefore, going long is risky at this price, since it is expensive.
That said, if the immediate resistance at \$107.0 holds, LTC/USD will likely dip toward \$100.0, aligning with yesterday's low.
Knowledge Should Be Free – And So Is Your Path to Trading Success.
Disclaimer
The information and publications are not meant to be, and do not constitute, financial, investment, trading, or other types of advice or recommendations supplied or endorsed by TradingView. Read more in the Terms of Use.
Knowledge Should Be Free – And So Is Your Path to Trading Success.
Disclaimer
The information and publications are not meant to be, and do not constitute, financial, investment, trading, or other types of advice or recommendations supplied or endorsed by TradingView. Read more in the Terms of Use.