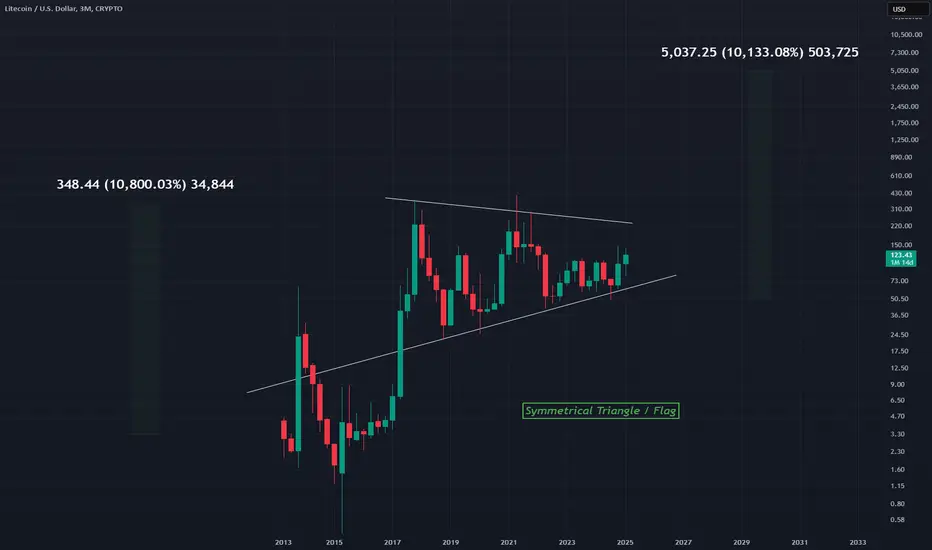
Litecoin on the 3M chart can be seen to have formed a large triangle that is priming itself to break out to the upside
If we compare the prior massive bull run of 10000% with another 10K % it puts Litecoin at like 5,000 which is crazy
The breakout is going to be great
This triangle is a symmetrical one or could be considered a bullflag
3M timeframe
If we compare the prior massive bull run of 10000% with another 10K % it puts Litecoin at like 5,000 which is crazy
The breakout is going to be great
This triangle is a symmetrical one or could be considered a bullflag
3M timeframe
Disclaimer
The information and publications are not meant to be, and do not constitute, financial, investment, trading, or other types of advice or recommendations supplied or endorsed by TradingView. Read more in the Terms of Use.
Disclaimer
The information and publications are not meant to be, and do not constitute, financial, investment, trading, or other types of advice or recommendations supplied or endorsed by TradingView. Read more in the Terms of Use.