LTC - This is how a Wyckoff Spring look like when reading SI
Reading the chart: Location, Structure, Speed Index and Plutus signals
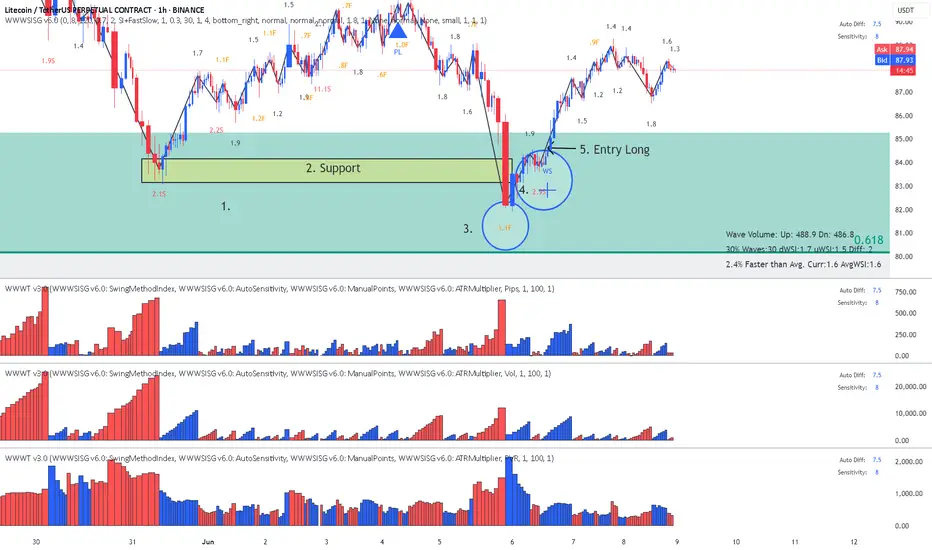
Annotations in sync with the chart.
1. Major Fib
2. Support
3. Breaking Support with a false break - Fast wave = low Speed Index 1.1
4. Down wave, price has a hard time to move down = high Speed Index 2.9 (buyers absorbing sell orders)
5. Entry a Wyckoff Spring WS signal from Plutus
.... and up we go!!!
Contact:info@tradethevolumeswaves.com
Site: tradethevolumewaves.com
Lesson 15: youtu.be/QPG59GWr5HQ?si=joaRCJgvyo-L2ntM
Site: tradethevolumewaves.com
Lesson 15: youtu.be/QPG59GWr5HQ?si=joaRCJgvyo-L2ntM
Disclaimer
The information and publications are not meant to be, and do not constitute, financial, investment, trading, or other types of advice or recommendations supplied or endorsed by TradingView. Read more in the Terms of Use.