🔍 Technical Analysis Summary:
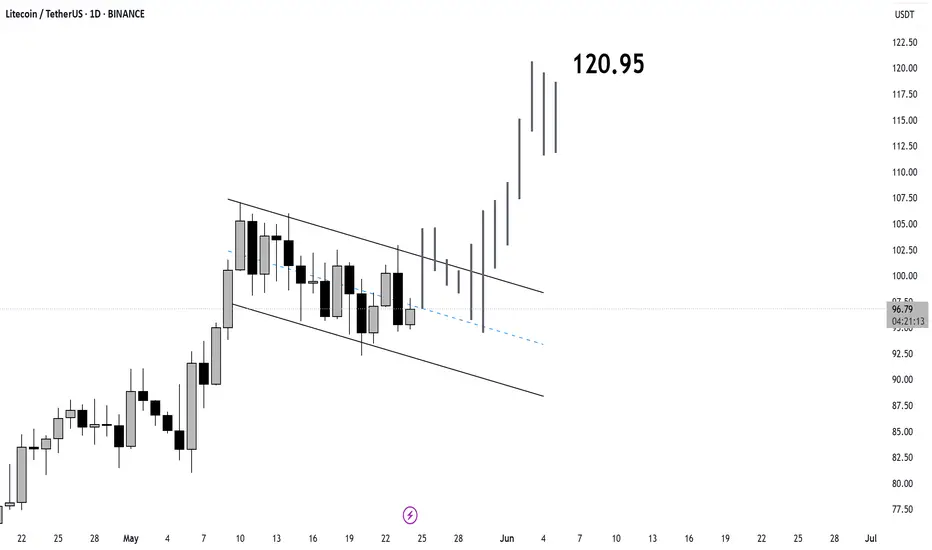
Pattern: Falling Wedge (bullish reversal pattern)
Breakout Direction: Upward breakout from the wedge appears to be projected.
Current Price: ~$96.72
Target Price: $120.95 (projected post-breakout target)
🟢 Bullish Signs:
The falling wedge typically signals a potential trend reversal to the upside.
The breakout projection suggests a strong upward movement is expected after accumulation.
📈 Price Targets:
Short-Term Resistance: $100.00 psychological level.
Main Target: $120.95 as shown on the chart.
🔻 Risk Management:
Key support lies within the wedge’s lower boundary around ~$90–92.
Break back below the wedge could invalidate the bullish outlook.
Summary:
Litecoin has formed a bullish falling wedge pattern. A breakout above the wedge could push the price toward the $120.95 target. Confirmation is needed with strong volume. Maintain stop-losses below the wedge support to manage risk.
Subscribe to my Telegram Channel 👉 :
t.me/addlist/y5mi70s3c0Y3MDQ0
Subscribe to my X 👉 : x.com/VIPROSETR
t.me/addlist/y5mi70s3c0Y3MDQ0
Subscribe to my X 👉 : x.com/VIPROSETR
Disclaimer
The information and publications are not meant to be, and do not constitute, financial, investment, trading, or other types of advice or recommendations supplied or endorsed by TradingView. Read more in the Terms of Use.