Litecoin is gearing up for a big move on the 1-hour chart!
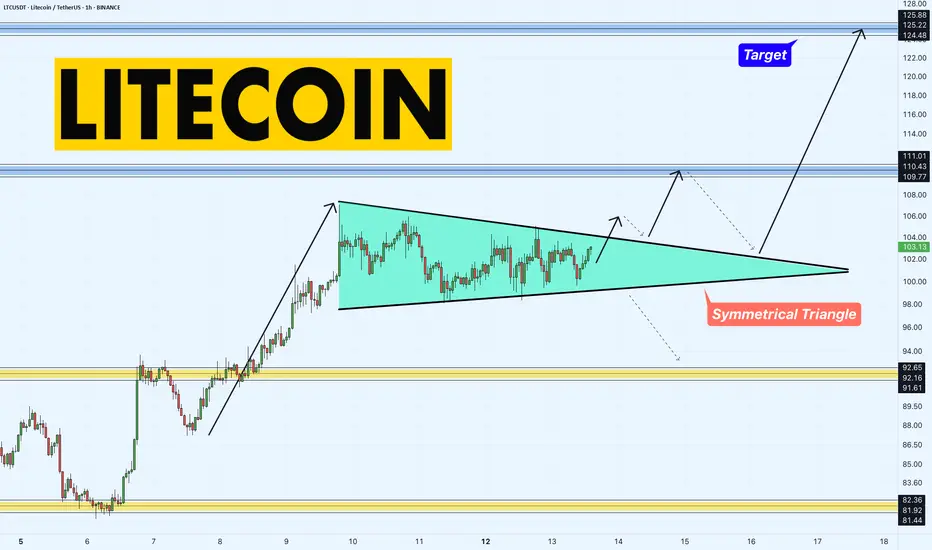
We’ve got a textbook Symmetrical Triangle forming, with LTCUSDT squeezing tighter and tighter between converging trendlines. The price is now approaching the upper resistance of the triangle around $104. This setup is screaming breakout potential!
If LTC clears the triangle’s resistance, we could see a strong push toward the $111.01 target — a key resistance level to watch. On the flip side, if it fails to break out, the $92.16 level (now potential support) will be critical to hold. Volatility is coming, and I’m ready for it — are you? Let’s see if Litecoin can spark a rally!

Key Levels to Watch:
What’s your take, traders? Are we breaking out or pulling back? Drop your thoughts below!
We’ve got a textbook Symmetrical Triangle forming, with LTCUSDT squeezing tighter and tighter between converging trendlines. The price is now approaching the upper resistance of the triangle around $104. This setup is screaming breakout potential!
If LTC clears the triangle’s resistance, we could see a strong push toward the $111.01 target — a key resistance level to watch. On the flip side, if it fails to break out, the $92.16 level (now potential support) will be critical to hold. Volatility is coming, and I’m ready for it — are you? Let’s see if Litecoin can spark a rally!
Key Levels to Watch:
Support: $92.16 (previous resistance, now support)
Resistance: $104 (triangle upper boundary)
Target: $111.01 and $125 (next major resistances)
What’s your take, traders? Are we breaking out or pulling back? Drop your thoughts below!
Trade closed: target reached
Short was better option! $92 we go!𝗔𝗥𝗧𝗘𝗠 𝗖𝗥𝗬𝗣𝗧𝗢 | 𝗦𝗶𝗻𝗰𝗲 𝟮𝟬𝟭𝟴
📲 Join Our Telegram Trading Community: t.me/+5hlxWmhHaKplN2Rk
🎙️ Daily Live Streams on 🔴 𝗬𝗼𝘂𝗧𝘂𝗯𝗲
🔍 Explore More Resources: linktr.ee/artemcrypto ✅
📲 Join Our Telegram Trading Community: t.me/+5hlxWmhHaKplN2Rk
🎙️ Daily Live Streams on 🔴 𝗬𝗼𝘂𝗧𝘂𝗯𝗲
🔍 Explore More Resources: linktr.ee/artemcrypto ✅
Disclaimer
The information and publications are not meant to be, and do not constitute, financial, investment, trading, or other types of advice or recommendations supplied or endorsed by TradingView. Read more in the Terms of Use.
𝗔𝗥𝗧𝗘𝗠 𝗖𝗥𝗬𝗣𝗧𝗢 | 𝗦𝗶𝗻𝗰𝗲 𝟮𝟬𝟭𝟴
📲 Join Our Telegram Trading Community: t.me/+5hlxWmhHaKplN2Rk
🎙️ Daily Live Streams on 🔴 𝗬𝗼𝘂𝗧𝘂𝗯𝗲
🔍 Explore More Resources: linktr.ee/artemcrypto ✅
📲 Join Our Telegram Trading Community: t.me/+5hlxWmhHaKplN2Rk
🎙️ Daily Live Streams on 🔴 𝗬𝗼𝘂𝗧𝘂𝗯𝗲
🔍 Explore More Resources: linktr.ee/artemcrypto ✅
Disclaimer
The information and publications are not meant to be, and do not constitute, financial, investment, trading, or other types of advice or recommendations supplied or endorsed by TradingView. Read more in the Terms of Use.