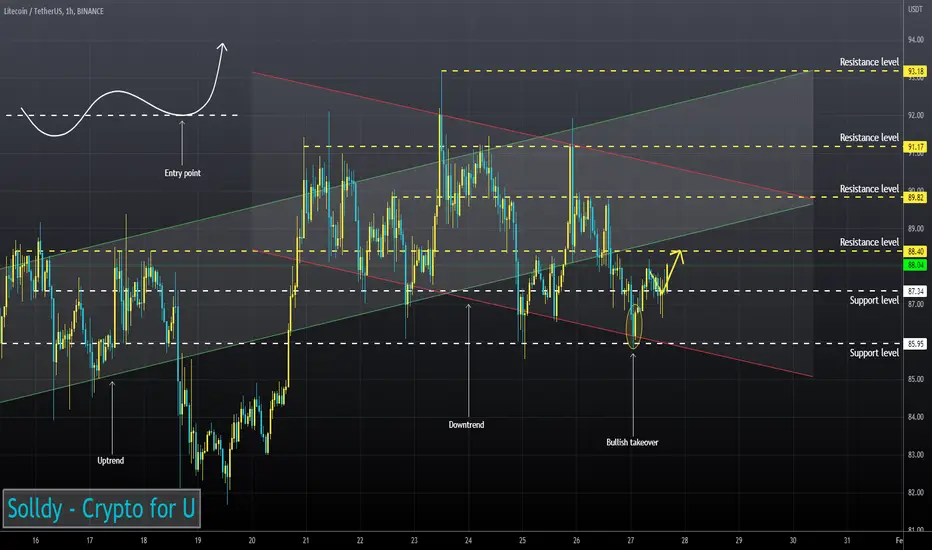
LTC is above the trading volumes.
The RSI chart is near neutral values.
Price is testing 50EMA (4H TF).
The chart has formed a bullish takeover (1H TF)
I expect the price to rise.
The RSI chart is near neutral values.
Price is testing 50EMA (4H TF).
The chart has formed a bullish takeover (1H TF)
I expect the price to rise.
Disclaimer
The information and publications are not meant to be, and do not constitute, financial, investment, trading, or other types of advice or recommendations supplied or endorsed by TradingView. Read more in the Terms of Use.
Disclaimer
The information and publications are not meant to be, and do not constitute, financial, investment, trading, or other types of advice or recommendations supplied or endorsed by TradingView. Read more in the Terms of Use.