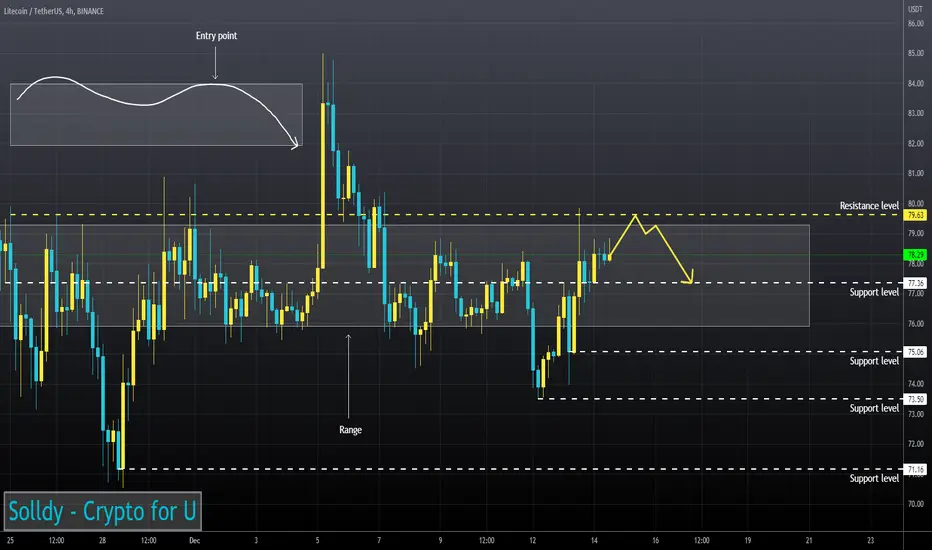
TD Sequential has formed a reversal signal down (4H TF)
The RSI chart on the 30m Timeframe signals an upcoming correction.
I expect the asset to begin a correction if it holds in the range.
The RSI chart on the 30m Timeframe signals an upcoming correction.
I expect the asset to begin a correction if it holds in the range.
Related publications
Disclaimer
The information and publications are not meant to be, and do not constitute, financial, investment, trading, or other types of advice or recommendations supplied or endorsed by TradingView. Read more in the Terms of Use.
Related publications
Disclaimer
The information and publications are not meant to be, and do not constitute, financial, investment, trading, or other types of advice or recommendations supplied or endorsed by TradingView. Read more in the Terms of Use.