Hi guys
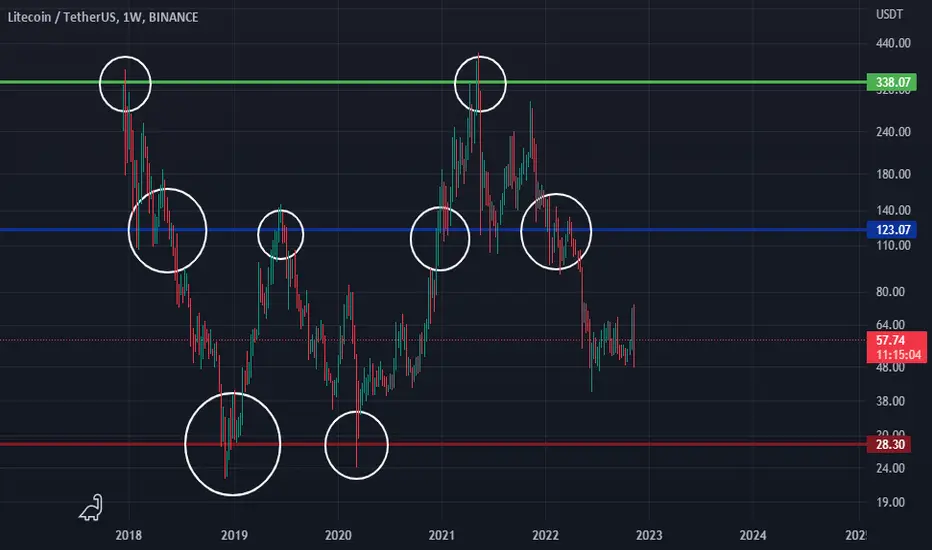
As you can see , in the weekly chart, the price has broken it's strong support , which we marked with the blue line.
Why strong support? We determined the number of collisions.
Red line :it's the last support , and approaching it is a good signal for long-term investment.
good luck
As you can see , in the weekly chart, the price has broken it's strong support , which we marked with the blue line.
Why strong support? We determined the number of collisions.
Red line :it's the last support , and approaching it is a good signal for long-term investment.
good luck
Disclaimer
The information and publications are not meant to be, and do not constitute, financial, investment, trading, or other types of advice or recommendations supplied or endorsed by TradingView. Read more in the Terms of Use.
Disclaimer
The information and publications are not meant to be, and do not constitute, financial, investment, trading, or other types of advice or recommendations supplied or endorsed by TradingView. Read more in the Terms of Use.