Hi All,
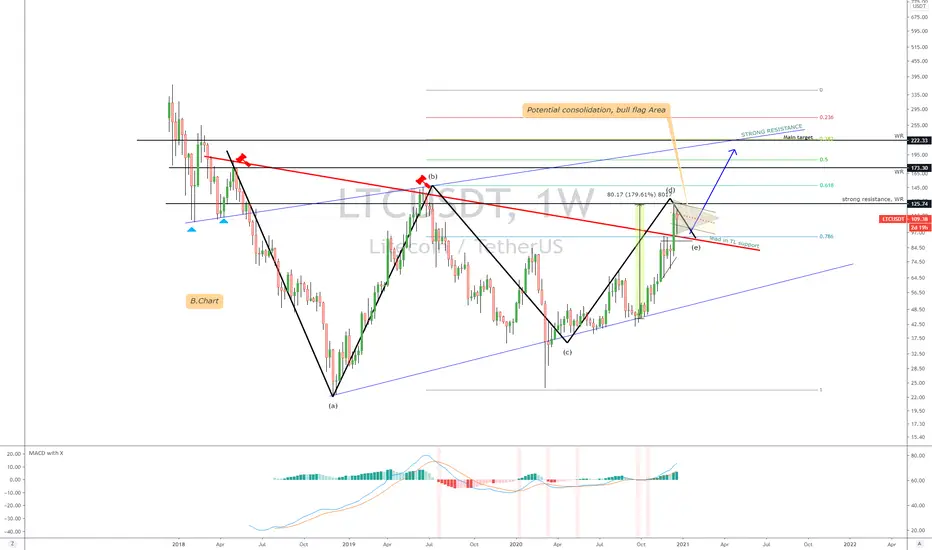
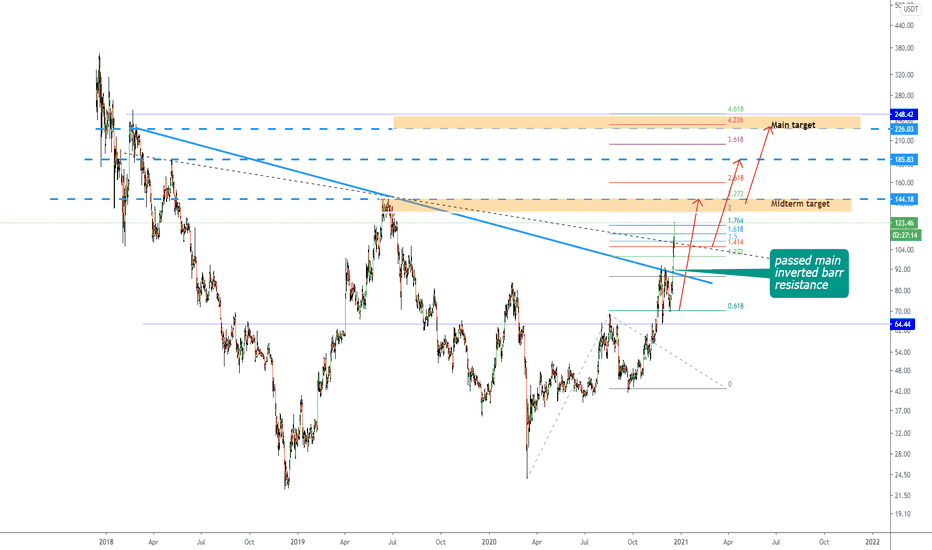
A continuation of the previous post with the recent drop and hence support validated at the lead in trend line as well as the fib level, its another piece of the puzzle that works towards a inverted barr structure and hence the main target.
As long as price is above the lead in Trend line, then my ABCD(E) where E is above the trend line, is valid otherwise Point E can also be on the below bottom blue support line.
On the weekly, we have the indicators showing upward pressure, bullish.
However on the weekly the RSI is at all time high so we can expect some resistance at this level and hence why I think its a consolidation area.
How to trade this, on the daily, buy the dips which is fits this structure, below.

The rest of the chart is self explanatory.
This makes the suggestion that BTC is also going to move up as LTC is its current shadow.
Until we see a bearish divergence on the daily, weekly, we should not start thinking about a large pullback.
So far, we don't have one.
Also not the bullish nature of the daily candle sticks of recent, for the past days, similar to BTC.
What do you think?
Please give me a like or tick for this post.
Regarsd,
S.SAri

PREVIOUS POST
A continuation of the previous post with the recent drop and hence support validated at the lead in trend line as well as the fib level, its another piece of the puzzle that works towards a inverted barr structure and hence the main target.
As long as price is above the lead in Trend line, then my ABCD(E) where E is above the trend line, is valid otherwise Point E can also be on the below bottom blue support line.
On the weekly, we have the indicators showing upward pressure, bullish.
However on the weekly the RSI is at all time high so we can expect some resistance at this level and hence why I think its a consolidation area.
How to trade this, on the daily, buy the dips which is fits this structure, below.
The rest of the chart is self explanatory.
This makes the suggestion that BTC is also going to move up as LTC is its current shadow.
Until we see a bearish divergence on the daily, weekly, we should not start thinking about a large pullback.
So far, we don't have one.
Also not the bullish nature of the daily candle sticks of recent, for the past days, similar to BTC.
What do you think?
Please give me a like or tick for this post.
Regarsd,
S.SAri
PREVIOUS POST
Note
lower time frames... a potential breakout.Note
Note
15 minute structure, bullishNote
Note
for now, I think its hit its resistance and hence will likely be sideways movement.Trade closed: stop reached
Note
post continued with the update post...target met.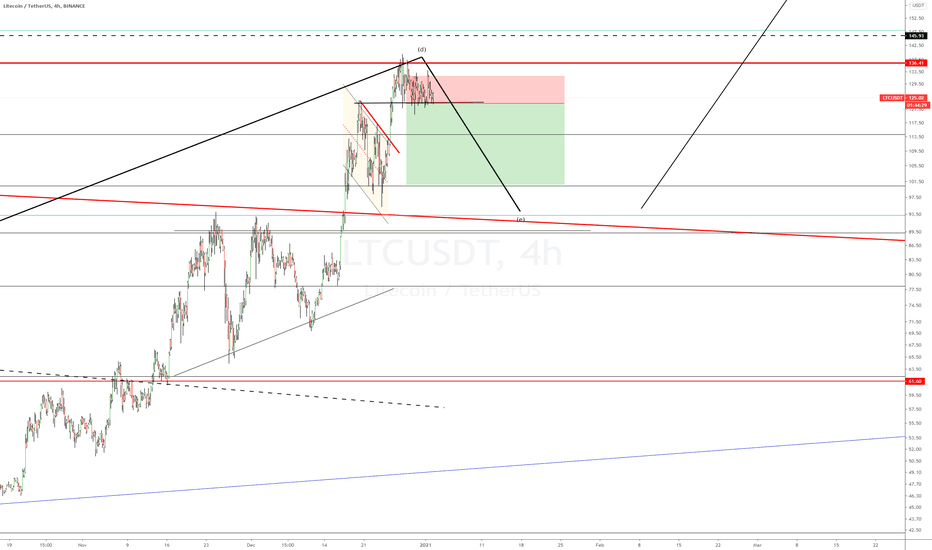
Discord: discord.com/invite/vb4hbP88vb (TradeToProspa)
Telegram: t.me/TprospaTradersbot
This community has signals now but with no risk management comms.
Telegram: t.me/TprospaTradersbot
This community has signals now but with no risk management comms.
Related publications
Disclaimer
The information and publications are not meant to be, and do not constitute, financial, investment, trading, or other types of advice or recommendations supplied or endorsed by TradingView. Read more in the Terms of Use.