🔍 LTIM Technical Analysis – Bearish Setup (April 23, 2025)
Chart Timeframe: 2H
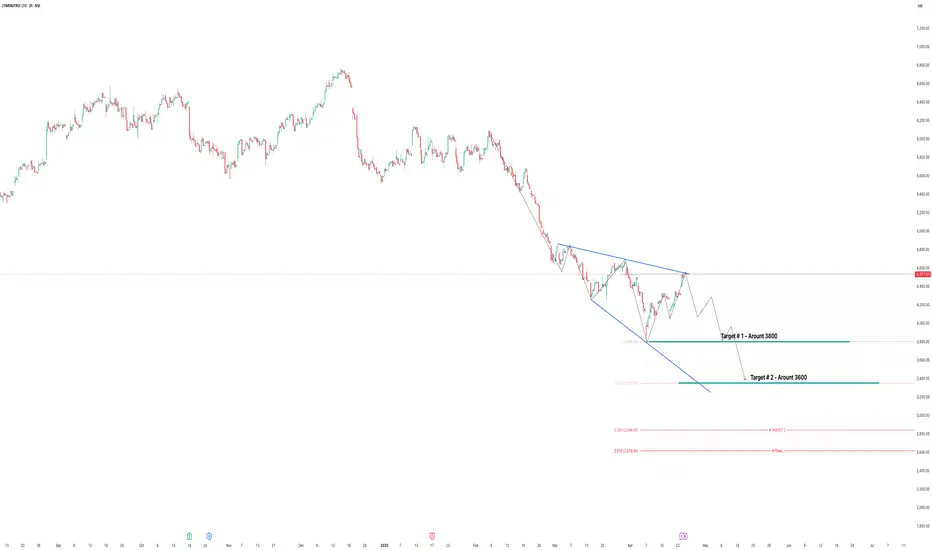
Current Price: ₹4337.00
Structure: Descending triangle within a larger bearish channel
Pattern Type: Bearish continuation with lower highs and lower lows
Wave Structure: Impulsive wave down followed by a corrective retracement
📉 Bearish Observations:
Lower Low Formation: The recent price action confirms a consistent lower low and lower high pattern, characteristic of a strong downtrend.
Bearish Flag / Wedge: Price has formed a narrowing wedge after a sharp decline — a classic bearish continuation pattern.
Resistance Zone: Price is currently testing the upper trendline of the wedge/triangle. Failing to break out confirms resistance.
Impulse Fall: The prior drop was sharp and aggressive, indicating strong selling pressure (impulsive wave).
Weak Retracement: The retracement leg lacks strength and volume, hinting at potential exhaustion of bulls.
🎯 Target Levels (Based on Breakdown):
Target #1: ₹3800
This aligns with prior price structure and Fib confluence zone.
Target #2: ₹3600
Based on extended move projections and measured height of the triangle.
Extension Levels (Marked in Pink):
1.618 Fib Extension: ₹3365
2.0 Fib Extension: ₹2846
2.618 Fib Extension (Final): ₹2618
⚠️ Key Risk Levels:
Invalidation Point: A breakout and sustained close above ₹4600 will invalidate this bearish setup.
Stop-Loss (for Shorts): Can be considered above the triangle breakout — ₹4620 zone.
🔔 Conclusion:
LTIM looks bearish on the 2H chart. The pattern suggests a high probability of continuation to the downside after this retracement. If it fails to cross above resistance, expect a move towards ₹3800, then ₹3600, with extended bearish targets around ₹2846–₹2618 if momentum continues.
📌 Disclaimer:
This is a technical analysis based on chart patterns and does not constitute financial advice. Always perform your own research and risk management before taking any position.
Chart Timeframe: 2H
Current Price: ₹4337.00
Structure: Descending triangle within a larger bearish channel
Pattern Type: Bearish continuation with lower highs and lower lows
Wave Structure: Impulsive wave down followed by a corrective retracement
📉 Bearish Observations:
Lower Low Formation: The recent price action confirms a consistent lower low and lower high pattern, characteristic of a strong downtrend.
Bearish Flag / Wedge: Price has formed a narrowing wedge after a sharp decline — a classic bearish continuation pattern.
Resistance Zone: Price is currently testing the upper trendline of the wedge/triangle. Failing to break out confirms resistance.
Impulse Fall: The prior drop was sharp and aggressive, indicating strong selling pressure (impulsive wave).
Weak Retracement: The retracement leg lacks strength and volume, hinting at potential exhaustion of bulls.
🎯 Target Levels (Based on Breakdown):
Target #1: ₹3800
This aligns with prior price structure and Fib confluence zone.
Target #2: ₹3600
Based on extended move projections and measured height of the triangle.
Extension Levels (Marked in Pink):
1.618 Fib Extension: ₹3365
2.0 Fib Extension: ₹2846
2.618 Fib Extension (Final): ₹2618
⚠️ Key Risk Levels:
Invalidation Point: A breakout and sustained close above ₹4600 will invalidate this bearish setup.
Stop-Loss (for Shorts): Can be considered above the triangle breakout — ₹4620 zone.
🔔 Conclusion:
LTIM looks bearish on the 2H chart. The pattern suggests a high probability of continuation to the downside after this retracement. If it fails to cross above resistance, expect a move towards ₹3800, then ₹3600, with extended bearish targets around ₹2846–₹2618 if momentum continues.
📌 Disclaimer:
This is a technical analysis based on chart patterns and does not constitute financial advice. Always perform your own research and risk management before taking any position.
Disclaimer
The information and publications are not meant to be, and do not constitute, financial, investment, trading, or other types of advice or recommendations supplied or endorsed by TradingView. Read more in the Terms of Use.
Disclaimer
The information and publications are not meant to be, and do not constitute, financial, investment, trading, or other types of advice or recommendations supplied or endorsed by TradingView. Read more in the Terms of Use.