The ladies love their overpriced leggings, but the stock market doesn’t.
LULU Daily chart analysis.
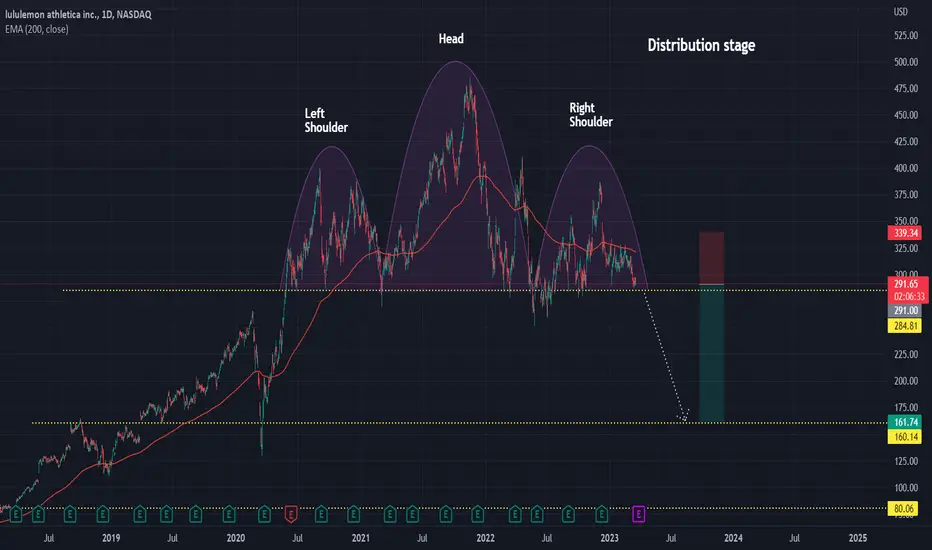
Their uptrend started March 2018 and came to an end December 2021.
Price has since been moving side-ways in a Distribution stage in form of a Head and Shoulders pattern. We need is break of neckline before price enters downtrend.
Entering trade short
Entry: 281.00
Stop loss: 339.34, (-16.61%)
Target: 161.74, +44.42%, 2.67 RR ratio
LULU Daily chart analysis.
Their uptrend started March 2018 and came to an end December 2021.
Price has since been moving side-ways in a Distribution stage in form of a Head and Shoulders pattern. We need is break of neckline before price enters downtrend.
Entering trade short
Entry: 281.00
Stop loss: 339.34, (-16.61%)
Target: 161.74, +44.42%, 2.67 RR ratio
Trade closed: stop reached
Stop loss: 339.34, (-16.61%)Trade active
Entry: 364.51Stop: 394, (-8.09%)
Target: 161.75, (+55.63%), 6.88 RR ratio
Disclaimer
The information and publications are not meant to be, and do not constitute, financial, investment, trading, or other types of advice or recommendations supplied or endorsed by TradingView. Read more in the Terms of Use.
Disclaimer
The information and publications are not meant to be, and do not constitute, financial, investment, trading, or other types of advice or recommendations supplied or endorsed by TradingView. Read more in the Terms of Use.