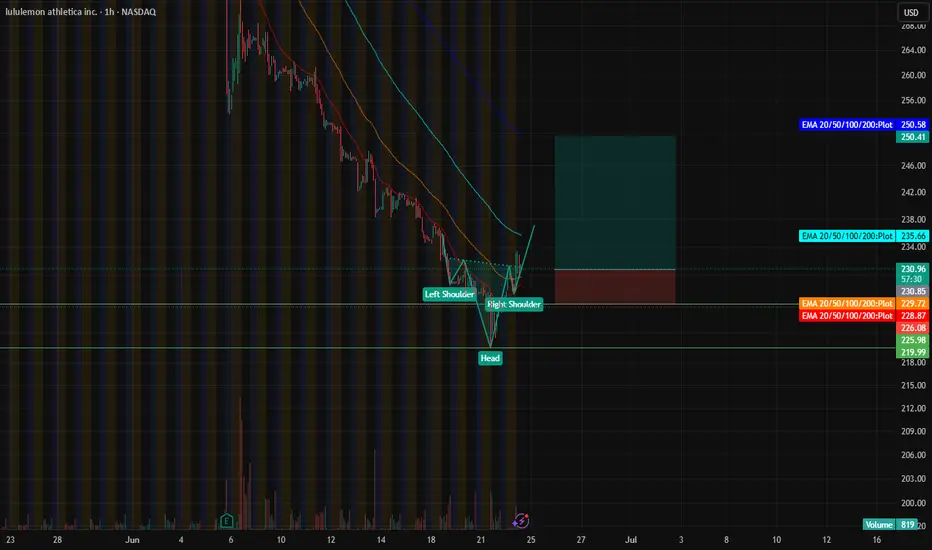
15-Minute Chart: Head and Shoulders Pattern
A head and shoulders pattern has formed on the 15-minute chart, signaling a potential reversal from a short-term downtrend, suggesting bullish momentum may be building.
Daily Chart: Hammer Candlestick & RSI Oversold
The daily chart shows a hammer candlestick pattern, indicating strong buying pressure at lower levels. Additionally, the RSI is in oversold territory, reinforcing the likelihood of a near-term rebound. These factors suggest a favorable setup for a long position in LULU.
Trade Recommendation
Consider initiating a long position in LULU based on the bullish signals across multiple timeframes.
Entry:231
Stop Loss (SL): Set at $226 (aligned with August 2024 resistance) or $219 (low of the hammer candlestick) for tighter risk management.
Take Profit 1 (TP1): Target $250–$252, corresponding to the 200-period EMA on the 1-hour and 4-hour charts, a likely resistance zone.(a 1:4 risk and reward ratio)
Take Profit 2 (TP2): Target $334, aiming to fill the gap from the last earnings report, with potential upside if tariff concerns ease.
Rationale
The combination of a reversal pattern on the 15-minute chart, a bullish hammer on the daily chart, and an oversold RSI supports a bullish outlook. Risk-reward ratios are attractive with defined stop-loss levels and realistic profit targets, contingent on market conditions and macroeconomic factors like tariff developments.
Trade active
TP1:252 Hit (Cashed 50%)TP2:Revised to 273
TP3:295
SL: Adjusted to Entry 231
Disclaimer
The information and publications are not meant to be, and do not constitute, financial, investment, trading, or other types of advice or recommendations supplied or endorsed by TradingView. Read more in the Terms of Use.
Disclaimer
The information and publications are not meant to be, and do not constitute, financial, investment, trading, or other types of advice or recommendations supplied or endorsed by TradingView. Read more in the Terms of Use.