Luna Classic 🌓 🌔 🌕
Hello Traders,
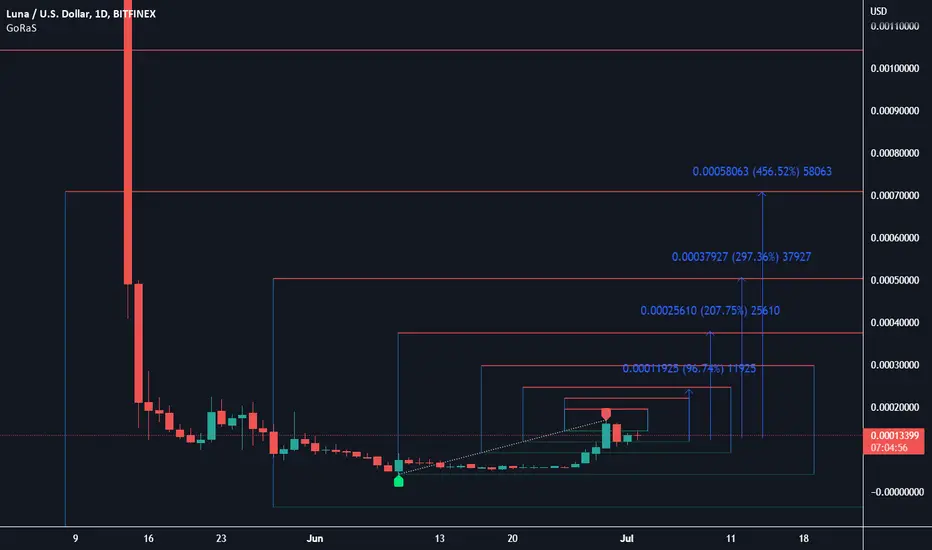
today I would like to analyze Luna Classic by plotting Fibonacci's Logarithmic Golden Spiral on the chart to identify on a daily timeframe what might be medium-term price targets.
❓First, what is the fibonacci spiral? ❓
I love to use this quote when I talk about it :
"The golden spiral is a pattern created based on the concept of the golden ratio—a universal law that represents the “ideal” in all forms of life and matter. In fact, it’s often cited as an example of the connection between the laws of mathematics and the structure of living things. The more we understand the math behind the symbol, the more we’ll appreciate its appearances in nature and arts. "
🔴Target levels are marked in red by the horizontal lines on the chart while support levels are marked in green.
🔴Also I would like to add that the vote passed on the burn transaction tax mechanism on Luna which means that each transaction will add a 1.2 % tax and the amount taxed will be burned to lower the total supply; this mechanism will allow Luna to burn up to 10 B ( at this amount will stop ) in about 800-1200 days based on an average previous 24H volume.
🔴 Interesting is the data on Binance which is accumulating Luna ( seems they hold 40-46 % of total supply currently )
🔴 Summarizing the targets/resistances in order :
➡️ 0.00022
➡️ 0.00024
➡️ 0.00029
➡️ 0.00037
➡️ 0.00050
➡️ 0.00070
➡️ 0.0010
❌Some financial stats according to CMC❌
❇️ Market Cap
$861,201,854
❇️ Fully Diluted Market Cap
$910,907,485
❇️ Volume 24h
$466,631,760
❇️ Circulating Supply
6,556.67B LUNC
❇️ Total Supply
6,906,229,037,364
Before investing or buying DYOR
Disclaimer
The information and publications are not meant to be, and do not constitute, financial, investment, trading, or other types of advice or recommendations supplied or endorsed by TradingView. Read more in the Terms of Use.
Disclaimer
The information and publications are not meant to be, and do not constitute, financial, investment, trading, or other types of advice or recommendations supplied or endorsed by TradingView. Read more in the Terms of Use.