*** ***
For this particular analysis on TERRA we are using the LUNAUSDT symbol on the Phemex exchange.
*** ***
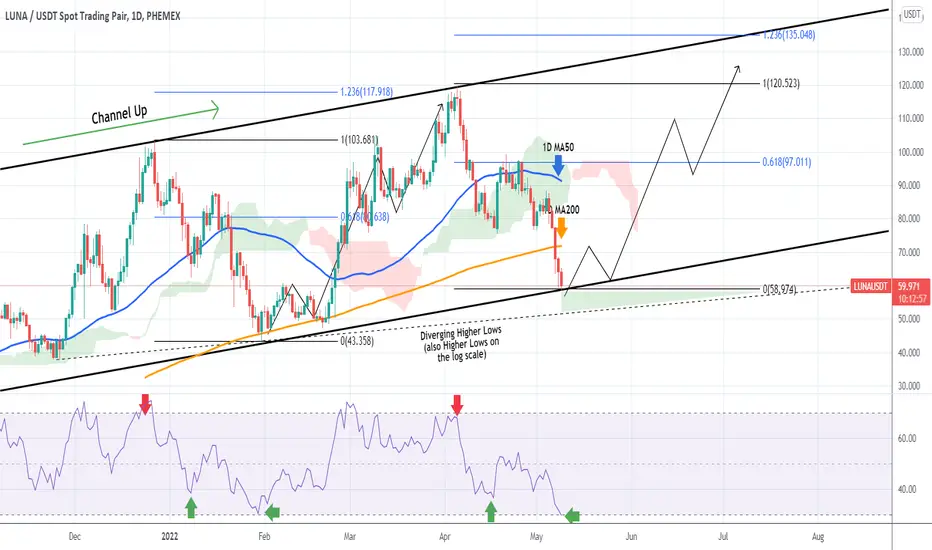
The idea is on the 1D chart with the blue trend-line being the 1D MA50 and the orange trend-line the 1D MA200. As shown, LUNAUSD has been trading within a Channel Up ever since its December 2021 High. Two Higher Lows and another Higher High have followed, forming the bullish trend on this Channel.
Today the price hit the Higher Lows trend-line (bottom) of this long-term Channel Up on the liner scale. On the log scale, there is still some room for a complete pull-back, which happens to be on this diverging Higher Lows trend-line as illustrated on the chart. The RSI (1D) is exactly on the level (oversold 30.000) where the last Higher Low was priced on January 30 2022. If those Support levels hold, we expect LUNA to gradually start the new rally to a Higher High within the Channel Up.
Attention is needed, as this time besides the 1D MA50, it also has the 1D MA200 as a Resistance on the short-term. Potential confirmation comes if the price breaks above it. The 0.618 Fibonacci retracement level ($97.000) can be used as a medium-term target with the 1.236 ($135.000) being the long-term (which priced the previous Higher High).
--------------------------------------------------------------------------------------------------------
** Please support this idea with your likes and comments, it is the best way to keep it relevant and support me. **
--------------------------------------------------------------------------------------------------------
For this particular analysis on TERRA we are using the LUNAUSDT symbol on the Phemex exchange.
*** ***
The idea is on the 1D chart with the blue trend-line being the 1D MA50 and the orange trend-line the 1D MA200. As shown, LUNAUSD has been trading within a Channel Up ever since its December 2021 High. Two Higher Lows and another Higher High have followed, forming the bullish trend on this Channel.
Today the price hit the Higher Lows trend-line (bottom) of this long-term Channel Up on the liner scale. On the log scale, there is still some room for a complete pull-back, which happens to be on this diverging Higher Lows trend-line as illustrated on the chart. The RSI (1D) is exactly on the level (oversold 30.000) where the last Higher Low was priced on January 30 2022. If those Support levels hold, we expect LUNA to gradually start the new rally to a Higher High within the Channel Up.
Attention is needed, as this time besides the 1D MA50, it also has the 1D MA200 as a Resistance on the short-term. Potential confirmation comes if the price breaks above it. The 0.618 Fibonacci retracement level ($97.000) can be used as a medium-term target with the 1.236 ($135.000) being the long-term (which priced the previous Higher High).
--------------------------------------------------------------------------------------------------------
** Please support this idea with your likes and comments, it is the best way to keep it relevant and support me. **
--------------------------------------------------------------------------------------------------------
👑Best Signals (Forex/Crypto+70% accuracy) & Account Management (+20% profit/month on 10k accounts)
💰Free Channel t.me/tradingshotglobal
🤵Contact info@tradingshot.com t.me/tradingshot
🔥New service: next X100 crypto GEMS!
💰Free Channel t.me/tradingshotglobal
🤵Contact info@tradingshot.com t.me/tradingshot
🔥New service: next X100 crypto GEMS!
Disclaimer
The information and publications are not meant to be, and do not constitute, financial, investment, trading, or other types of advice or recommendations supplied or endorsed by TradingView. Read more in the Terms of Use.