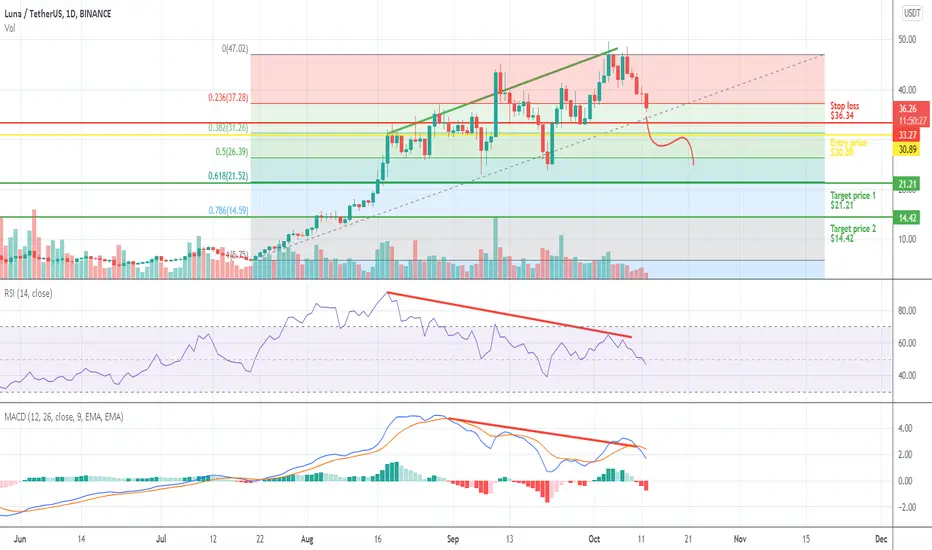
Macd line has just passed below the signal line, indicating the presence of a bearish momentum. This crossing is interpreted like a sell signal.
RSI and MACD indicators created a bearish divergence with price. This means that probably the price movement could reverse soon.
Fibonacci zone is used to provide us support and resistance. In particular we put on the chart an entry price ($30.89) on yellow support line.
In conclusion, before opening a short position we need a confirmation. The price should break out the support and then retest it as a resistance.
no financial advice
💥 Free signals and ideas ➡ t.me/vfinvestment
Disclaimer
The information and publications are not meant to be, and do not constitute, financial, investment, trading, or other types of advice or recommendations supplied or endorsed by TradingView. Read more in the Terms of Use.
💥 Free signals and ideas ➡ t.me/vfinvestment
Disclaimer
The information and publications are not meant to be, and do not constitute, financial, investment, trading, or other types of advice or recommendations supplied or endorsed by TradingView. Read more in the Terms of Use.